
Join Our Telegram channel to stay up to date on breaking news coverage
Quant (QNT) Price Prediction – November 15
The effects of bears’ actions recently in most worldly known crypto economies seem to be heading to a conclusive session as the QNT/USD market rebuilds upswings around the $100 trading line. In the last few hours, the price has traded between $125.66 and $109.07 at a positive percentage rate of 11.52.
QNT/USD Market
Key Levels:
Resistance levels: $150, $160, $170
Support levels: $100, $190, $180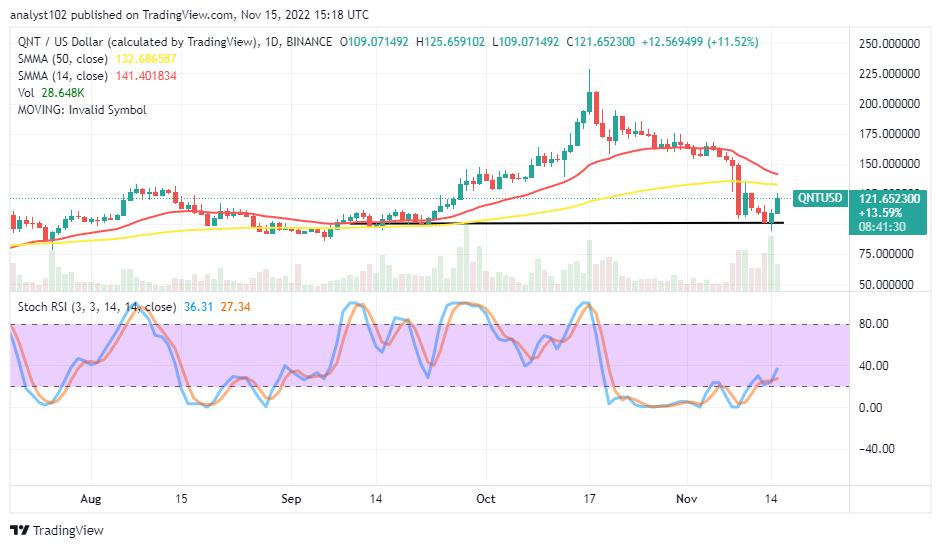
QNT/USD – Daily Chart
The QNT/USD daily chart reveals that the crypto market rebuilds upswings at the $100 support level after a long path of declining movements. The 14-day SMA indicator is at $141.401834, slightly bending southward over the $132.686587 value line of the 50-day SMA indicator. The horizontal line is drawn at a lower end, marking where the current upswings have taken off. Over time, the Stochastic Oscillators have been in the oversold range, moving in a consolidation pattern. They now swerve slightly northbound around 27.34 and 36.31 altitudes.
What will be the following price reaction prognosis if the QNT/USD market bulls abandon their positions?
As the QNT/USD trade activity rebuilds upswings at the $100 trading level, an unprecedented reversal-moving mode against the trend will potentially lead the price to a re-testing situation of the value line. Based on that psychological trading myth, long-position placers may have no course to panic sell-off time. Rather than that, they are to leave their positions to run without overleveraging orders. Investors expected to add more to their portfolios if that presumed scenario plays out.
On the downside of the technical analysis, the QNT/USD market bears forces and may have to regain positions between the resistances of $125 and $150. However, if a breakout upsurges through those points, short-position placers will have to wait for confirmation of a possible retracement around the $175 resistance level to launch a sell order afterward. Sellers will have to hold on hold and exercise patience for some time to allow another round of selling patterns to form.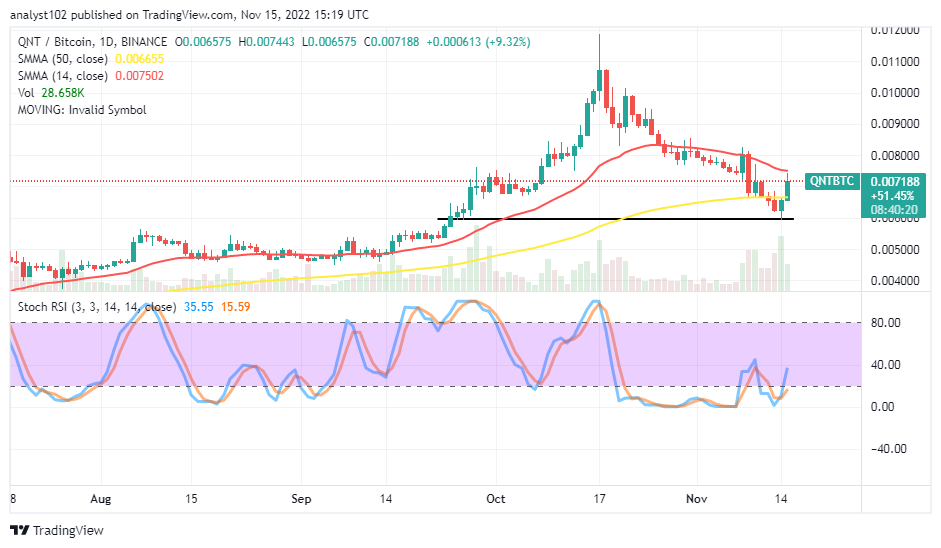
QNT/BTC Price Analysis
In comparison, Quant’s trending ability has reduced to a maximal lower-trading zone against Bitcoin. In the meantime, the cryptocurrency pair rebuilds upswings around the horizontal line drawn closely beneath the trend line of the bigger SMA trend line. The 14-day SMA indicator is above the 50-day SMA indicator. The Stochastic Oscillators have crossed northbound from the overbought region to 15.59 and 35.55 levels, denoting that the base crypto is pulling up against its counter-trading crypto.
This Is the Best Time to Invest in Dash 2
This is an excellent time to purchase D2T tokens, and one of the reasons is that CZ of Binance has already announced an industry recovery plan for crypto projects. So far, the Dash 2 Trade presale has raised about $6.5 million.
Related
Join Our Telegram channel to stay up to date on breaking news coverage