Join Our Telegram channel to stay up to date on breaking news coverage
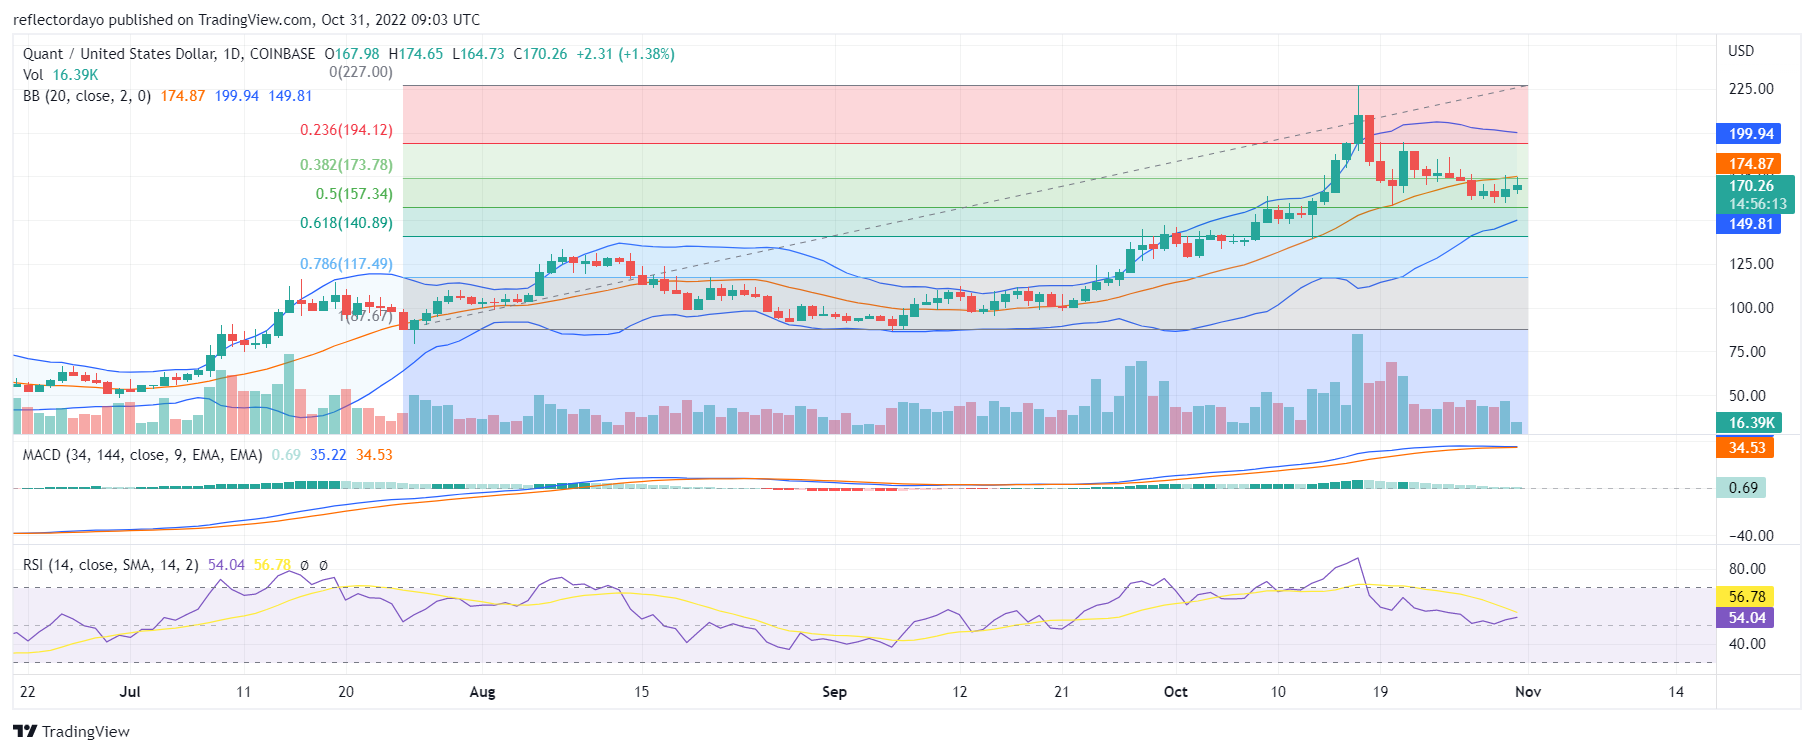
Quant Market Price Statistic:
- QNT/USD price now: $170.82
- QNT/USD market cap: $
- QNT/USD circulating supply:
- QNT/USD total supply:
- QNT/USD coin market ranking: #
Key Levels
- Resistance: $175, $180, $185
- Support: $160, $155, $150
Quant Market Price Analysis: The Indicators’ Point of View
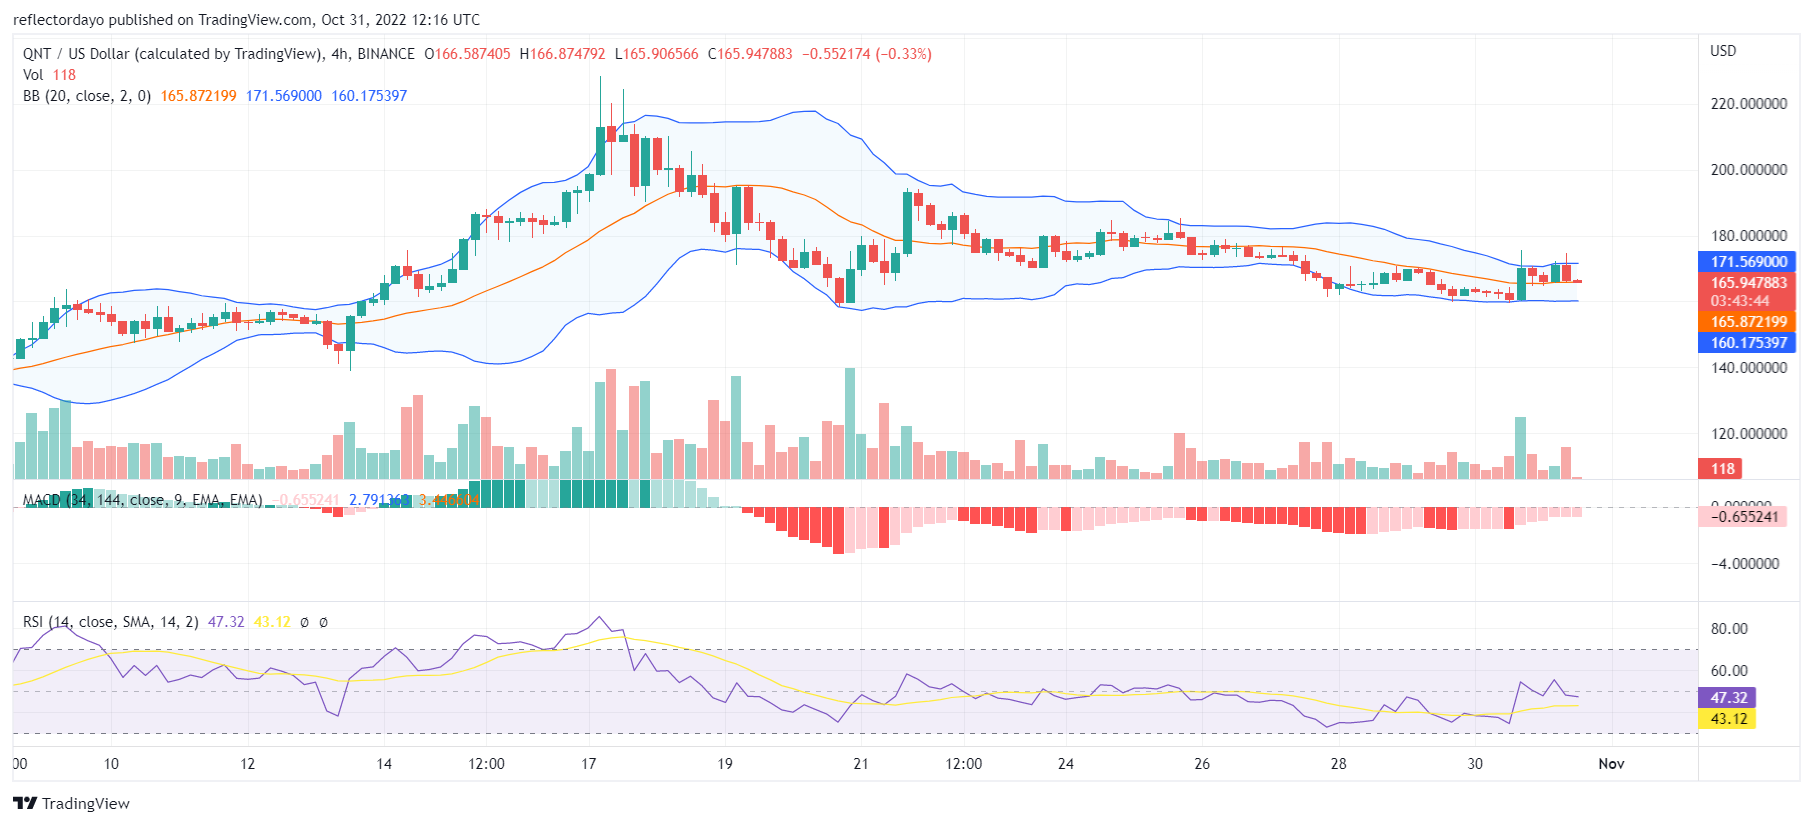
Buyers were able to form strong support against the bearish market move at $164 on the 27th of October. In the market today, buyers are targeting a higher price level. Although the price is still below the Bollinger moving average (that means the market is leaning slightly to the side of the bears), it is now attempting to rise above the moving average. However, the RSI line is still measuring in the bullish zone of the indicator.
QNT/USD 4-Hour Chart Outlook
In this timeframe, the price action came above the Bollinger moving average in the fourth session. And it has established a basis above the moving average for upward price performance. The MACD indicator has been portraying negative histograms because the price action has been moving below the moving average for some periods. And from the RSI indicator, the line has pulled back from 55.8% to retrace 52%. Bearish pressure is increasing at this point. And as a result of this, the price may continue to range sideways.
The Dash 2 Trade presale has raised more than $3 million in less than two weeks since it began. One of this year’s most explosive token sales is this one.
Related
Join Our Telegram channel to stay up to date on breaking news coverage
