
Join Our Telegram channel to stay up to date on breaking news coverage
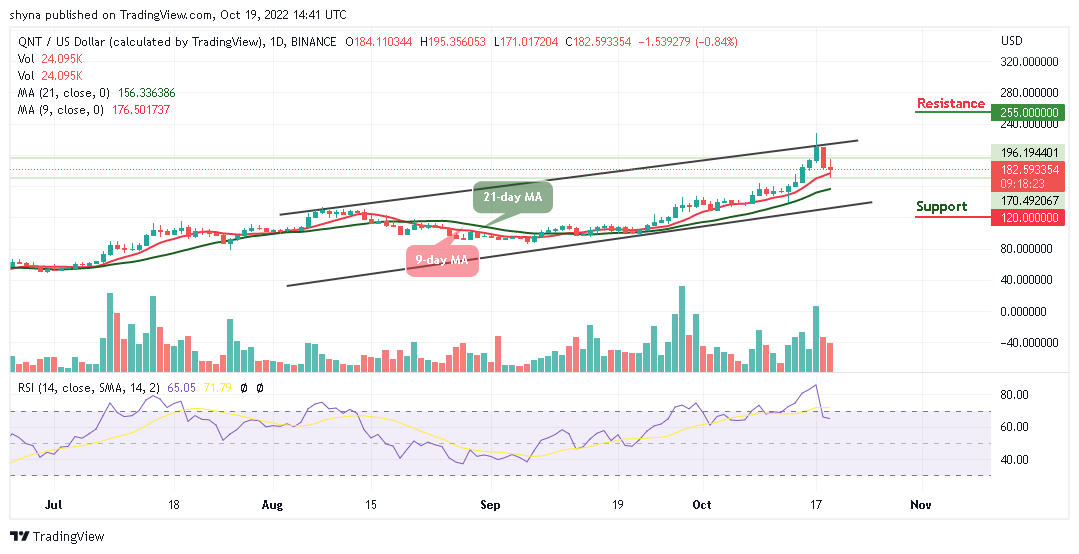
The Quant price prediction shows that QNT is currently changing hands at $182.5 as the coin retreats below the resistance level of $195.
Quant Prediction Statistics Data:
- Quant price now – $182.59
- Quant market cap – $2.2 billion
- Quant circulating supply – 12 million
- Quant total supply – 14.6 million
- Quant Coinmarketcap ranking – #29
QNT/USD Market
Key Levels:
Resistance levels: $255, $265, $275
Support levels: $120, $110, $100
QNT/USD is currently trading around $182.5, and once it manages to hit the potential resistance level of $195, it could locate the next target resistance at $209. Therefore, if this level fails to hold strong, the Quant price could slip back below the 9-day moving average.
Quant Price Prediction: QNT Ready for a Break Above $195 Level
The Quant price may close above the opening price of $184, however, if the bulls step back into the market and push the coin towards the upper boundary of the channel, QNT/USD could hit the potential resistance levels of $255, $265, and $275. Nonetheless, any further bullish movement above these key resistance levels may encourage more buyers to come into the market.
On the contrary, a break below the 9-day moving average may provoke a deep decline towards the lower boundary of the channel which could touch the critical supports at $120, $110, and $100. Meanwhile, according to the technical indicator Relative Strength Index (14), Quant may tend to follow a downtrend as the signal line crosses below the 70-level.
Against Bitcoin, the QNT price keeps hovering above the 9-day and 21-day moving averages in other to reach the resistance level of 10000 SAT. Unless this resistance is effectively exceeded and the price ends up closing above it, there might not be any reason to expect a long-term bullish reversal.
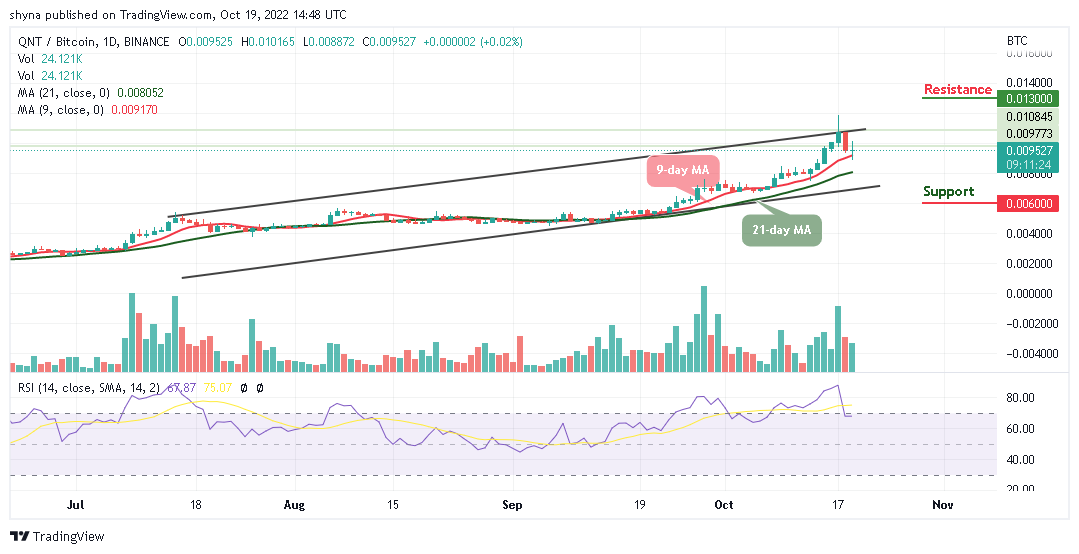
However, crossing below the moving averages could refresh lows under 8000 SAT, and a possible bearish continuation may likely meet the major support at 6000 SAT and below, but any bullish movement above the upper boundary of the channel may push the coin to the potential resistance level of 13000 SAT and above. Meanwhile, the Relative Strength Index (14) slides below the 70-level, which indicates that bearish signals may come to play.
One alternative to Bitcoin is the IMPT token, which is on presale now at the link below and has raised $4.5 million so far.
Related:
Join Our Telegram channel to stay up to date on breaking news coverage