
Join Our Telegram channel to stay up to date on breaking news coverage
The Quant price prediction shows that QNT is likely to cross above the upper boundary of the channel as the coin shoots to the upside.
Quant Prediction Statistics Data:
- Quant price now – $110.54
- Quant market cap – $1.3 billion
- Quant circulating supply – 12 million
- Quant total supply – 14.8 million
- Quant Coinmarketcap ranking – #39
QNT/USD Market
Key Levels:
Resistance levels: $125, $130, $135
Support levels: $95, $90, $85
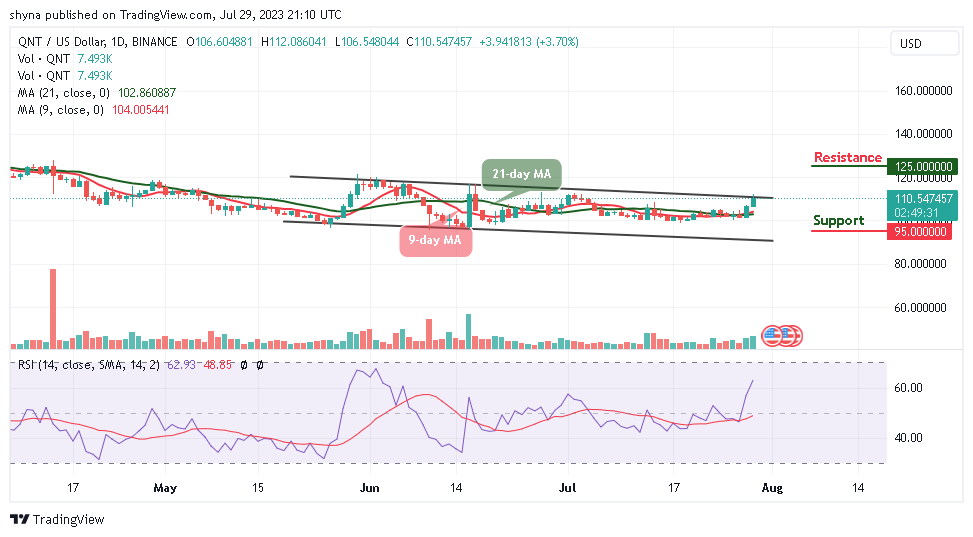
QNT/USD is currently trading at $110.5 after starting today’s trade with the opening price of $106.6 and it is likely to remain above the 9-day and 21-day moving averages. However, in case the buyers were able to push the price above the resistance level of $115, the daily candlestick may close above this level, and the price could rally above the channel.
Quant Price Prediction: Quant Gets Ready for Upward Movement
Looking at the daily chart, the Quant price could move close to the resistance level of $115 to prepare for the upside. However, the technical indicator Relative Strength Index (14) is moving above the 60-level with the signal line pointing up to indicate a buy signal.
Nevertheless, if the buyers were able to push the price above the channel, the Quant price could hit the potential resistance levels of $125, $130, and $135 while sliding toward the lower boundary of the channel may bring the coin to the supports at $95, $90, and $85 respectively.
When compares with Bitcoin, the Quant price is following a bullish surge, and it may swing high to cross above the upper boundary of the channel to locate the resistance level of 4200 SAT and above. On the contrary, if the market price crosses below the 9-day and 21-day moving averages, it could reach the support level of 3200 SAT and below.
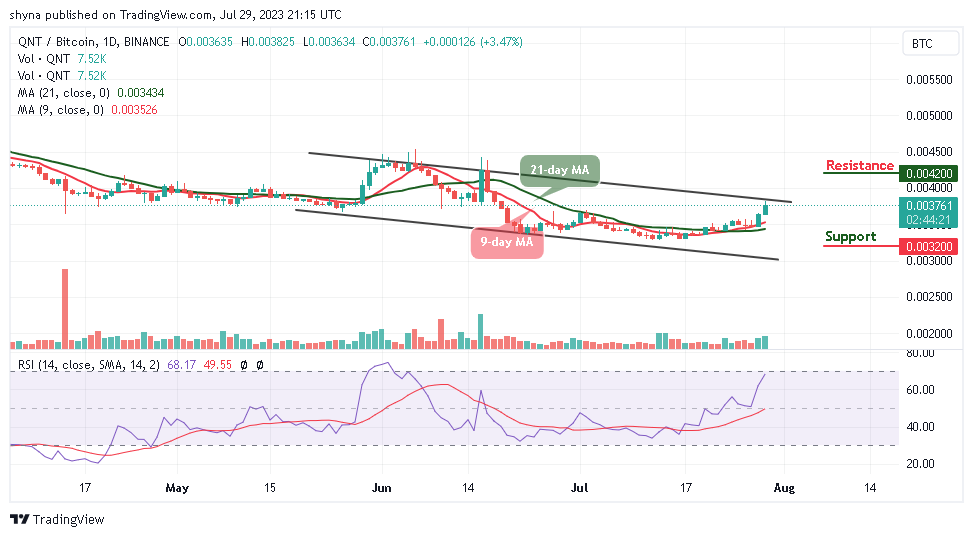
However, the technical indicator Relative Strength Index (14) is currently moving to cross into the overbought region as the signal line points to the north to confirm the bullish movement. Moreover, any further bullish movement may create additional gains above the channel.
Quant Alternatives
The Quant price is currently changing hands at $110.5 after the coin moves to touch the daily high of $112. However, traders are anticipating that the current price movement is an indication of the upcoming price rally in the market, and crossing above the upper boundary of the channel may increase the chance of buyers.
On that note, Wall Street Memes has an established community and a team that has already proven itself in the crypto industry. Therefore, the presale has raised almost $19 million since the token has been launched and investors are encouraged to invest in the token before the end of the presale.
New OKX Listing - Wall Street Memes

- Established Community of Stocks & Crypto Traders
- Featured on Cointelegraph, CoinMarketCap, Yahoo Finance
- Rated Best Crypto to Buy Now In Meme Coin Sector
- Team Behind OpenSea NFT Collection - Wall St Bulls
- Tweets Replied to by Elon Musk
Join Our Telegram channel to stay up to date on breaking news coverage