Join Our Telegram channel to stay up to date on breaking news coverage
The Origin Protocol price prediction faces the south as further downside may likely cross below the moving averages.
Origin Protocol Statistics Data:
- Origin Protocol price now – $0.108
- Origin Protocol market cap – $61.4 million
- Origin Protocol circulating supply – 559.2 million
- Origin Protocol total supply – 1 billion
- Origin Protocol Coinmarketcap ranking – #327
OGN/USD Market
Key Levels:
Resistance levels: $0.150, $0.155, $0.160
Support levels: $0.080, $0.075, $0.070
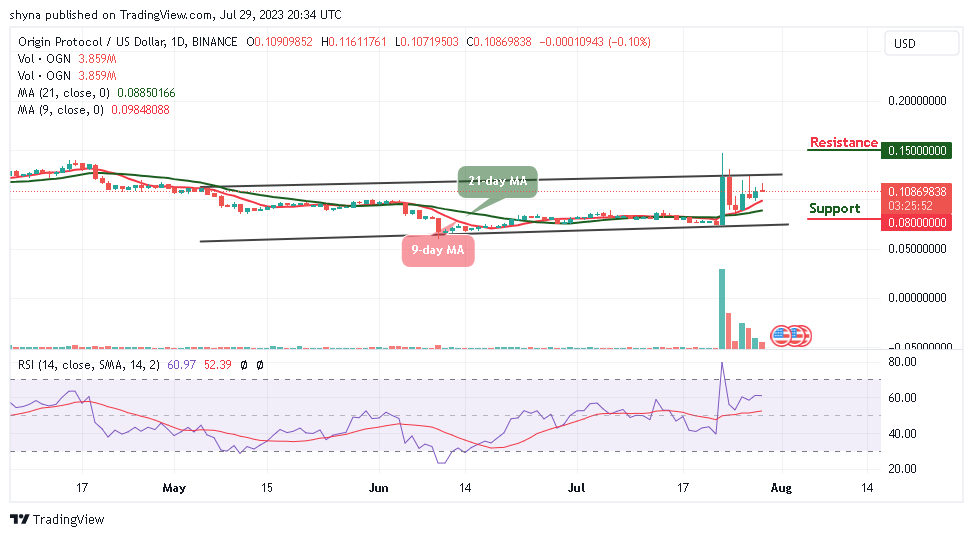
OGN/USD is sliding toward the 9-day and 21-day moving averages as the coin could reach the $0.107 support; the Origin Protocol price begins a steady decline toward the south. However, as the coin faces a bearish movement, it may target the support at $0.106 as the price could move into a short-term bearish zone.
Origin Protocol Price Prediction: OGN Price May Move to the South
At the time of writing, the Origin Protocol price is currently exchanging hands at $0.108, and any attempt to cross below the moving averages may likely bring it toward the lower boundary of the channel. Meanwhile, traders may experience a quick buy if the coin reaches the support at $0.106, but traders should keep their eyes on the resistance levels of $0.150, $0.155, and $0.160.
Moreover, if the price fails to rebound, a bearish breakout is likely to trigger more downfalls for traders, which might cause the price to touch the nearest support and could further drop to $0.080, $0.075, and $0.070 support levels. The technical indicator Relative Strength Index (14) is likely to cross below the 60-level as the coin may fall more.
Against Bitcoin, the Origin Protocol price is seen moving in sideways as the coin remains above the 9-day and 21-day moving averages. However, if a rebound comes to play, the coin may face an upward trend, and the bullish continuation may take it to the resistance level of 500 SAT and above.
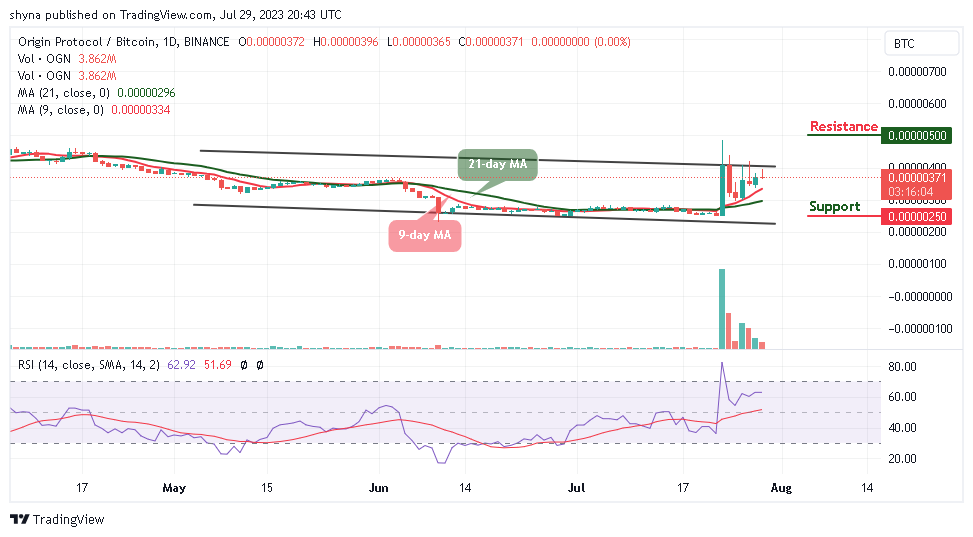
Looking at the daily chart, if the bulls failed to hold the bearish movement, it may likely fall toward the moving averages, and the nearest support level lies at 250 SAT and below. However, the technical indicator Relative Strength Index (14) is above the 60-level, which indicates a sideways movement.
Origin Protocol Alternatives
The Origin Protocol price is seen trading above the 9-day and 21-day moving averages as the coin prepares for a bullish run toward the upper boundary of the channel if the buyers increase the pressure. Meanwhile, the break above the channel is the first signal needed for a bullish to press higher.
Nevertheless, However, Wall Street Memes token continues to generate a lot of buzz in the crypto market. This new meme coin currently in presale has established an enormous following and looks poised to mint a new set of crypto millionaires. Meanwhile, in the ongoing presale, the token has raised almost $19 million.
New OKX Listing - Wall Street Memes

- Established Community of Stocks & Crypto Traders
- Featured on Cointelegraph, CoinMarketCap, Yahoo Finance
- Rated Best Crypto to Buy Now In Meme Coin Sector
- Team Behind OpenSea NFT Collection - Wall St Bulls
- Tweets Replied to by Elon Musk
Join Our Telegram channel to stay up to date on breaking news coverage