Join Our Telegram channel to stay up to date on breaking news coverage
The Polkadot price prediction is facing a downward trend; the dip is likely to increase because of a recent decline in the crypto world.
Polkadot Prediction Statistics Data:
- Polkadot price now – $6.15
- Polkadot market cap – $6.9 billion
- Polkadot circulating supply – 1.13 billion
- Polkadot total supply – 1.2 billion
- Polkadot Coinmarketcap ranking – #12
DOT/USD Market
Key Levels:
Resistance levels: $8.0, $8.5, $9.0
Support levels: $5.0, $4.5, $4.0
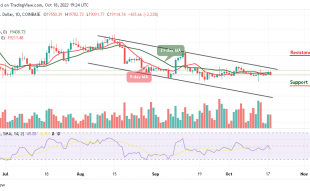
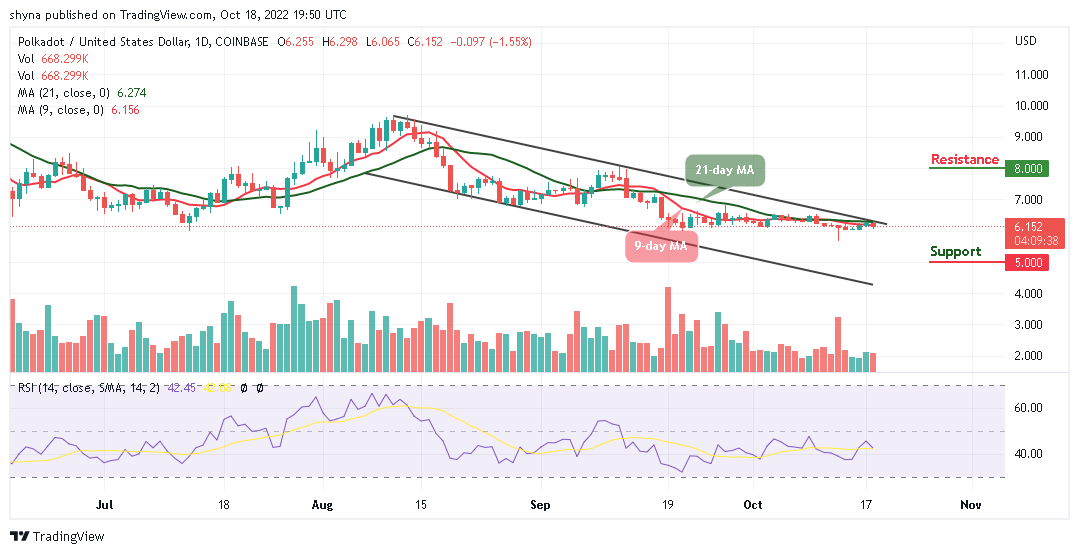
DOT/USD is heading to the negative side as the current pullback has been across the board, and Polkadot is taking a strong hit as well. At the time of writing, the Polkadot price is hovering at $6.15, it is dropping below the 9-day and 21-day moving averages.
Polkadot Price Prediction: Polkadot Price May Head to the South
The Polkadot price is seen heading to the downside as the coin slides below the 9-day and 21-day moving averages. On the downside, a move towards the lower boundary of the channel may increase the short-term selling pressure as the next supports may come at $5.0, $4.5, and $4.0 respectively. Meanwhile, any bullish movement above the upper boundary of the channel may reach the next resistance levels at $8.0, $8.5, and $9.0.
On the positive side, the technical indicator could start a new bullish session. It is, however, not clear how long the current session will last because, for the past few weeks, the bearish signals are more frequent than the bullish signals. Therefore, it is important to watch the support levels coupled with the movement of other indicators to analyze the next possible direction that the coin may follow.
Against Bitcoin, the Polkadot price remains below the 9-day and 21-day moving averages trading at 3201 SAT. Looking at the daily chart, if the coin can make cross above this barrier, the bulls may end up dominating the market. On the contrary, if the market drops below the support level of 3100 SAT, the next key support may come at 3000 SAT and below.
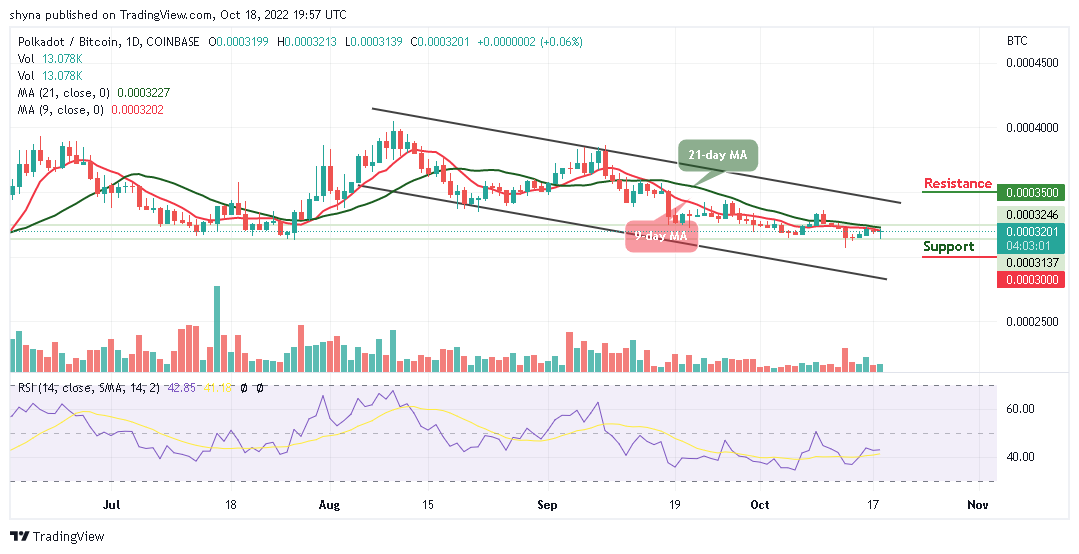
On the bullish side, a possible rise above the moving averages could push the market towards the upper boundary of the channel which could hit the resistance level of 3500 SAT and above. According to the technical indicator Relative Strength Index (14), the market may begin to move sideways as the signal line moves in the same direction.
Related:
Join Our Telegram channel to stay up to date on breaking news coverage