Join Our Telegram channel to stay up to date on breaking news coverage
The Polkadot price prediction still maintains sideways movement but couldn’t break above the 9-day and 21-day moving averages.
Polkadot Prediction Statistics Data:
- Polkadot price now – $6.3
- Polkadot market cap – $6.9 billion
- Polkadot circulating supply – 1.1 billion
- Polkadot total supply – 1.2 billion
- Polkadot Coinmarketcap ranking – #11
DOT/USD Market
Key Levels:
Resistance levels: $8.0, $8.5, $9.0
Support levels: $5.0, $4.5, $4.0
Your capital is at risk
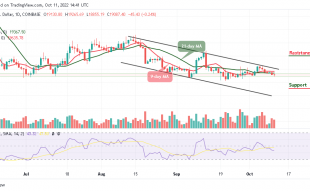
At the time of writing, DOT/USD begins to follow the bearish movement as the coin is seen moving toward the lower boundary of the channel. Meanwhile, the current market situation isn’t impressive at all as the coin may create additional bearish signals.
Polkadot Price Prediction: Polkadot (DOT) May Decline Heavily
Looking at the daily chart, $8.0, $8.5, and $9.0 are significant resistance levels if the bulls push the Polkadot price above the upper boundary of the channel. On the downside, if the price faces the lower boundary of the channel, it could cause a bearish wave, and beneath this, further supports could be found at $5.0, $4.5, and $4.0. The technical indicator Relative Strength Index (14) is likely to cross below the 40-level, suggesting a price drop.
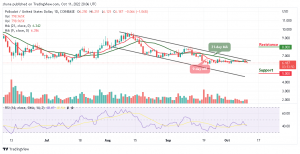
Against Bitcoin, DOT is likely to begin a bullish movement as the coin moves to cross above the 21-day moving average. However, the Polkadot price has been moving bearishly for the past few weeks, but if the coin crosses into the positive side, the nearest resistance level could be found at 3300 SAT. Above this, higher resistance could be located at 3600 SAT and above.

However, from below; the nearest level of support lies at 3100 SAT. Beneath this, the coin may slide towards the lower boundary of the channel. Lower support could be found at 3000 SAT and below. Meanwhile, the technical indicator Relative Strength Index (14) is moving below the 50-level, which shows that the coin is likely to move sideways. On the other hand, traders may need to see DOT/BTC rise and break towards the upper boundary of the channel.
Join Our Telegram channel to stay up to date on breaking news coverage