Join Our Telegram channel to stay up to date on breaking news coverage
The Polkadot (DOT) price prediction shows that DOT gains 2.37% in the last 24 hours to touch the daily high at $6.31.
Polkadot Prediction Statistics Data:
- Polkadot price now – $6.3
- Polkadot market cap – $7 billion
- Polkadot circulating supply – 1.1 billion
- Polkadot total supply – 1.2 billion
- Polkadot Coinmarketcap ranking – #11
DOT/USD Market
Key Levels:
Resistance levels: $8.5, $9.0, $9.5
Support levels: $4.5, $4.0, $3.5
Your capital is at risk
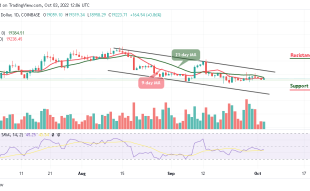
DOT/USD has been moving sideways for the past few days but manages to regain some ground amid technical correction from the downward trend where it is traveling from $6.08 to $6.31. However, the range of the price swings has been between $6.0 and $6.5.
Polkadot Price Prediction: What to Expect from Polkadot (DOT)
Moreover, though the current price of Polkadot at $6.31 is below the 9-day moving averages and 21-day moving averages within the descending channel, the recovery seems to have started as the technical indicator Relative Strength Index (14) faces the north. The Polkadot (DOT) needs to continue its up-trending growth in the coming days to recover properly. As per the current trend, the next resistance level is likely at $8.5, $9.0, and $9.5.
On the downside, a sustainable move towards the lower boundary of the channel could open up the way to a $6.1 support level, and this barrier may likely slow down the bears and then serve as a jumping-off ground for the recovery. Meanwhile, the next support levels to watch for could be $4.5, $4.0, and $3.5.
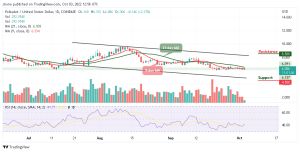
Against Bitcoin, DOT continues to trend bearishly as the support further outweighs the resistance. In case of a trend reversal, there is a need for an increasing volume to cause an upsurge in the market. Now, DOT/USD is trading around the 3277 SAT below the moving averages. Traders can expect close support at 2800 SAT and below.
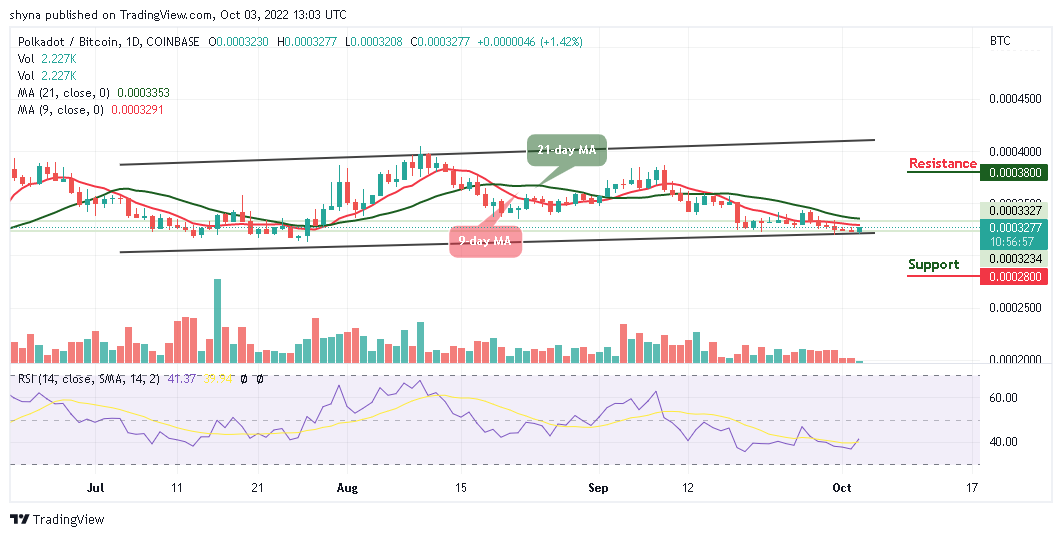
For now, there’s a little sign of a bullish trend in the market but the 9-day moving average remains below the 21-day moving average. However, if a bullish move occurs and validates a break significantly above the moving averages, the price could hit the nearest resistance at 3500 SAT; we can then confirm a bull run for the coin. More so, the closest resistance lies at 3800 SAT and above as the Relative Strength Index (14) crosses above the 40-level.
Join Our Telegram channel to stay up to date on breaking news coverage