Join Our Telegram channel to stay up to date on breaking news coverage
Polkadot Price Prediction – July 24
The Polkadot market price keeps range moves within $5 and $10 value lines, running for several weeks until now. Price is trading at a positive percentage rate of 1.23, around $7 as of writing.
Polkadot (DOT) Statistics:
DOT price now – $7.42
DOT market cap – $7.3 billion
DOT circulating supply – 987.6 million
DOT total supply – 1.1 billion
Coinmarketcap ranking – #12
DOT/USD Market
Key Levels:
Resistance levels: $10, $12, $14
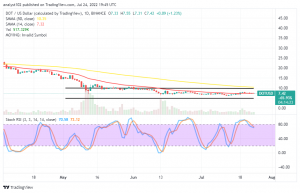
Support levels: $5, $4, $3 GMT/USD – Daily Chart
The DOT/USD daily chart reveals the crypto-economic market keeps range moves within the $5 and the $10 value lines as horizontal lines drew to mark the points. The 14-day SMA indicator is underneath the 50-day SMA. And they are at $7.32 and $10.35 in different value lines, respectively. The Stochastic Oscillators have briefly crossed southbound from the overbought region against the range of 80.
Is it worthy of trading in the DOT/USD current manner of range-bound trading style?
The DOT/USD current manner of range-bound trading style has somewhat been hard to observe a clear-cut position entry as the crypto’s price keeps range moves within $5 and $10 value lines going for some weeks now. However, smaller time frames such as 1-hour and 4-hour may be instrumental in what price tends to do in the following few hours from a particular trading spot at a given time.
On the downside of the technical analysis, the DOT/USD market bears may have the advantage of pushing the price down from the area of trading close underneath the trend line of the 50-day SMA as it maintains a $10.35 resistance value point. A sudden fearful breakout at this point seems unrealistic in the present outlook. If it does happen, it will most likely allow short-position placers to get settled to start looking for a higher-resistance level that can give back to a correction to push back into a downward=trending motion afterward.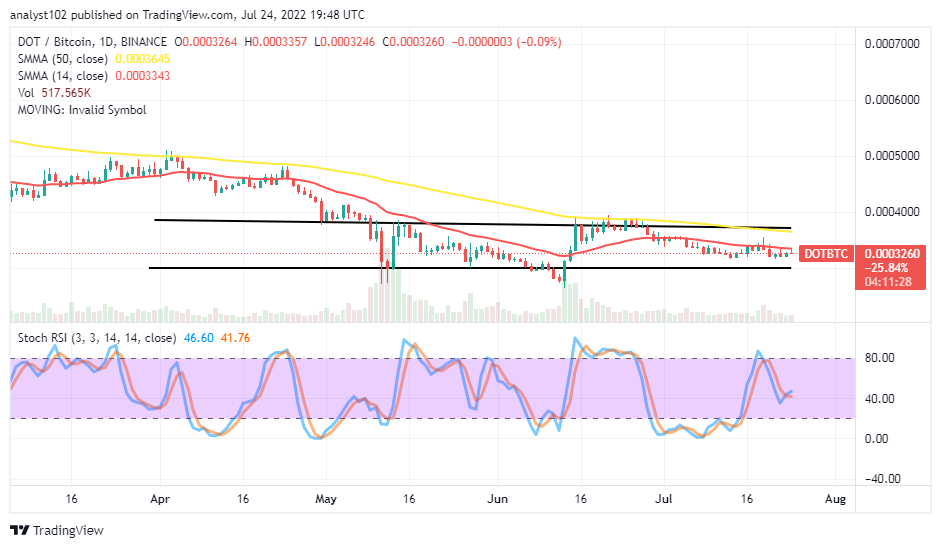
DOT/BTC Price Analysis
In comparison, Polkadot is relatively down against the trending capacity of Bitcoin in definite range-bound zones. As of writing, the cryptocurrency pair price keeps range moves within the upper and the lower horizontal lines drawn. The 50-day SMA indicator aligns with the upper horizontal line above the 14-day SMA indicator, which features between the range-bound spots. The Stochastic Oscillators have crossed southbound from the range of 80 down to the 40 range, seemingly trying to cross northbound. That indicates the base crypto is somewhat struggling not to give a damn to its counter-trading crypto..
Read more:
Join Our Telegram channel to stay up to date on breaking news coverage