Join Our Telegram channel to stay up to date on breaking news coverage
The Orchid price prediction shows that OXT may shoot to the upside as the bulls prepare to take the coin to higher levels.
Orchid Prediction Statistics Data:
- Orchid price now – $0.061
- Orchid market cap – $59 million
- Orchid circulating supply – 962.6 million
- Orchid total supply – 1 billion
- Orchid Coinmarketcap ranking – #307
OXT/USD Market
Key Levels:
Resistance levels: $0.080, $0.090, $0.100
Support levels: $0.040, $0.030, $0.020
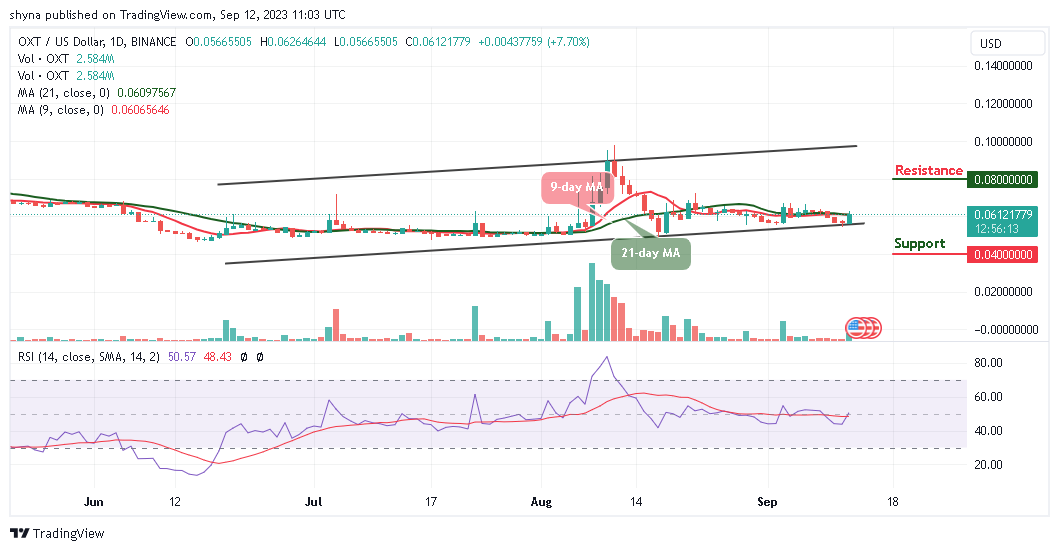
OXT/USD is trading above $0.060 as the coin trades near the 9-day and 21-day moving averages to touch the resistance level of $0.062. The Orchid may continue to move upwards if the price crosses above the 9-day and 21-day moving averages. Meanwhile, OXT/USD could reach the resistance level of $0.065 if the bulls focus on the upward trend.
Orchid Price Prediction: OXT Gets Ready for a Spike
The Orchid price may remain on the positive side should the 9-day moving average cross above the 21-day moving average. Meanwhile, the technical indicator Relative Strength Index (14) also confirms the bullish movement as the signal line moves to cross above the 50-level. Therefore, there is a higher chance that the coin may find the potential resistance levels at $0.080, $0.090, and $0.100.
Meanwhile, if the Orchid (OXT) slides below the lower boundary of the channel, bears could step back into the market and any bearish movement below this barrier may bring the coin to reach the critical supports at $0.040, $0.030, and $0.020 respectively.
OXT/BTC May Begin the Upward Movement
Against Bitcoin, the Orchid is likely to head to the upside as the coin moves to cross above the 9-day and 21-day moving averages. However, if the bullish movement continues, the next level of resistance may surface, and this may cause OXT/BTC to locate the key resistance at 300 SAT and above.
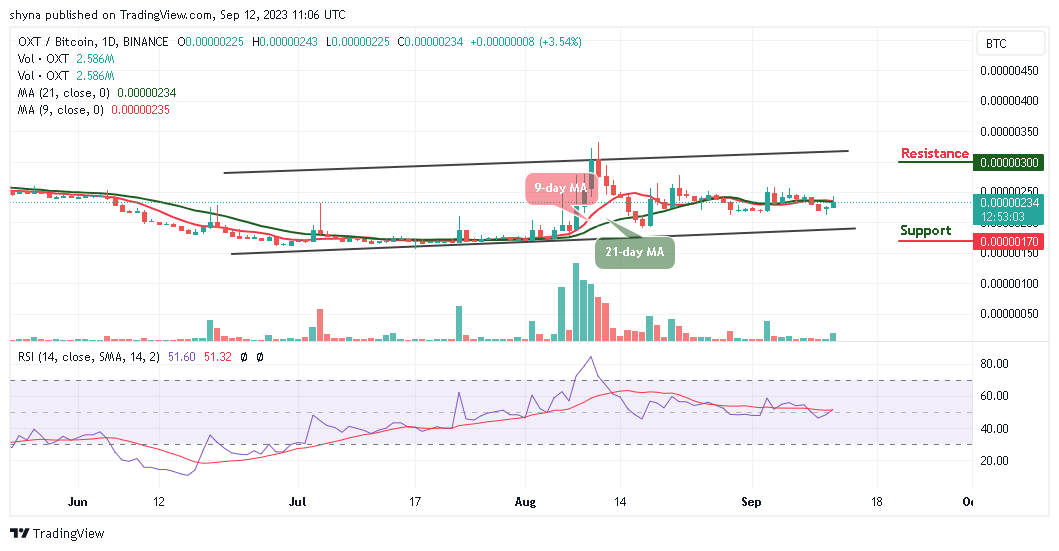
On the downside, the Orchid price could face support at 200 SAT. Beneath this, the critical support level could be located at 170 SAT and below. At the moment, the 9-day MA may cross above the 21-day MA as the technical indicator Relative Strength Index (14) moves above the 50-level to increase the bullish movement. Meanwhile, if the signal retreats below the 50 level, traders are likely to expect bearish pressure below the channel.
Alternatives to Orchid
After OXT/USD touches the high at $0.062 on the daily chart, the coin needs to experience more breaks to the positive side. The Orchid price is seen posting gains of over 7.70% in the last 24 hours, aiming to cross above the 9-day and 21-day moving averages at $0.061 while the technical indicator Relative Strength Index moves to cross above the 50-level.
Simultaneously, Wall Street Memes ($WSM) has garnered more than $25 million in its presale, positioning itself for the imminent official exchange launch. Investors, seize the moment! The Wall Street Memes ($WSM) token has surged to become one of the year’s biggest crypto sensations.
CoinCodex - Our Recommended Crypto Research Platform

- Live Cryptocurrency Prices for Over 20,000 Coins
- Crypto Price Analysis with Popular Technical Indicators
- Crypto Price Predictions with Short and Long-Term Charts
- Historical Crypto Market Data Dating to 2010
- Crypto Portfolio, Profit Calculator, and Other Investment Tools
Join Our Telegram channel to stay up to date on breaking news coverage