Join Our Telegram channel to stay up to date on breaking news coverage
The Orchid price prediction shows that OXT may stay above the 9-day and 21-day moving averages to begin the upward trend.
Orchid Prediction Statistics Data:
- Orchid price now – $0.064
- Orchid market cap – $63.8 million
- Orchid circulating supply – 962.6 million
- Orchid total supply – 1 billion
- Orchid Coinmarketcap ranking – #299
OXT/USD Market
Key Levels:
Resistance levels: $0.090, $0.100, $0.110
Support levels: $0.040, $0.030, $0.020
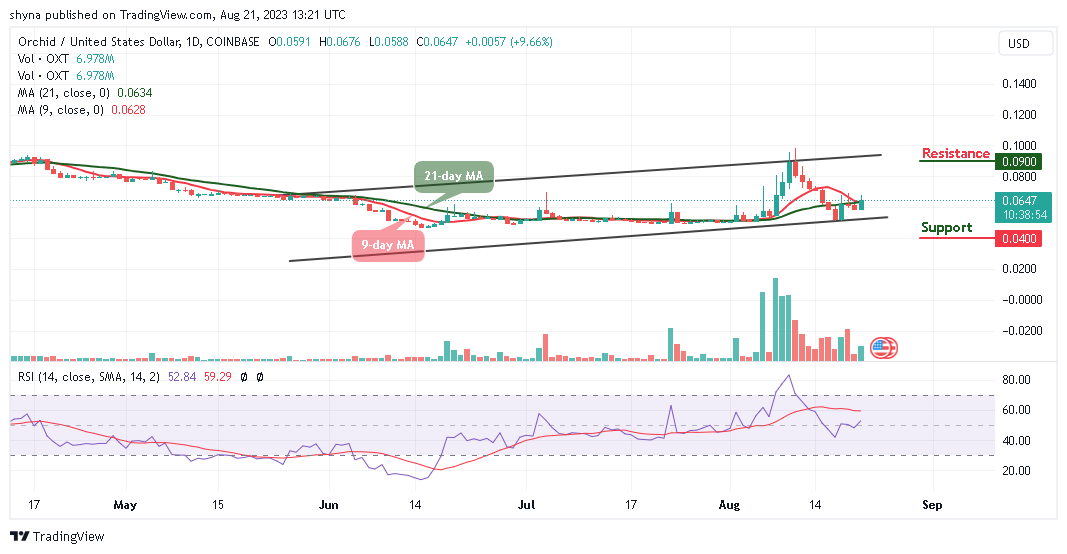
OXT/USD is currently changing hands at around $0.064 as the coin touches the daily high at $0.067 with a market cap of $63.9 million. Today’s trading begins with upward movement as the coin crosses above the 9-day and 21-day moving averages. According to the daily chart, traders are anticipating that the current price movement is an indication of the upcoming price rally in the market.
Orchid Price Prediction: Orchid May Gain More Uptrends
Looking at the daily chart, the next step for the Orchid price is to stay above the 9-day and 21-day moving averages. Once this is confirmed, bulls may now push the coin toward the upper boundary of the channel which could hit the resistance levels at $0.090, $0.100, and $0.110.
However, as the technical Indicator Relative Strength Index (14) moves above the 50-level, OXT/USD may continue to face the upside, once this plays out, it can manage to sustain the bullish movement above the 9-day and 21-day moving averages. Meanwhile, if the price slides and head toward the lower boundary of the channel, the support levels could be found at $0.040, $0.030, and $0.020 respectively.
OXT/BTC Bullish Bias Continues
When compares with Bitcoin, the Orchid price is moving bullishly above the 9-day and 21-day moving averages as the coin heads to the north. At the moment, bulls are to push the coin above the upper boundary of the channel as the technical Indicator Relative Strength Index (14) moves to cross above the 60-level.
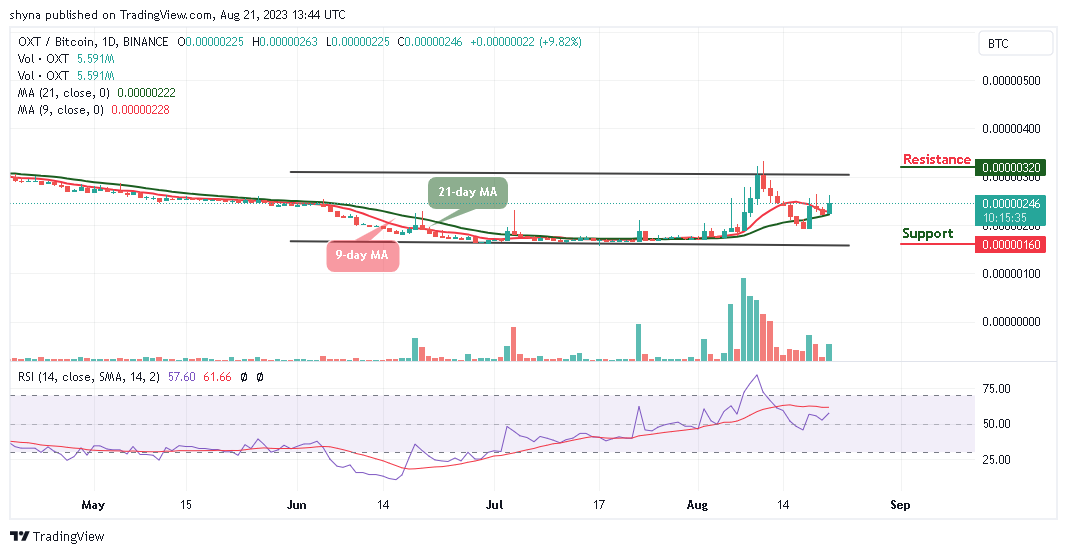
Moreover, if the buyers push the market price above the channel, OXT/BTC could rise to hit the resistance level of 320 SAT and above. On that note, the continuation of the bullish movement may keep the price above the moving averages. In other words, if the bears step into the market and bring the coin below the opening price of 225 SAT, any further bearish movement may cause the coin to hit the support level of 160 SAT and below.
Orchid (OXT) Alternatives
According to the daily chart, the Orchid bulls are coming into focus, and if the buyers put more effort, pushing the coin above the resistance level of $0.070 may create additional gains and this could encourage more buyers to invest in the coin.
Meanwhile, the presale for the new meme coin Wall Street Memes ($WSM) has now raised over $25 million and has entered its final stage ahead of the coin’s official exchange launch. However, the presale has now progressed through 30 stages, gradually increasing the $WSM price as it meets fundraising milestones.
New OKX Listing - Wall Street Memes

- Established Community of Stocks & Crypto Traders
- Featured on Cointelegraph, CoinMarketCap, Yahoo Finance
- Rated Best Crypto to Buy Now In Meme Coin Sector
- Team Behind OpenSea NFT Collection - Wall St Bulls
- Tweets Replied to by Elon Musk
Join Our Telegram channel to stay up to date on breaking news coverage