
Join Our Telegram channel to stay up to date on breaking news coverage
The Orchid price prediction could set a bullish run if the market can keep the coin above the resistance level of $0.075.
Orchid Prediction Statistics Data:
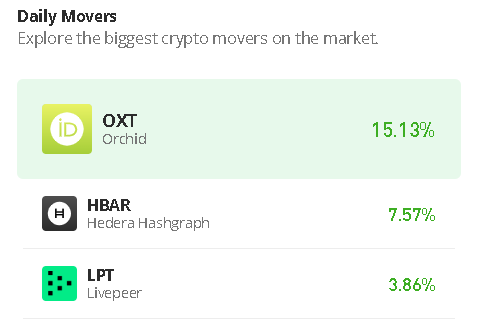
- Orchid price now – $0.061
- Orchid market cap – $58 million
- Orchid circulating supply – $66 million
- Orchid total supply – $1 billion
- Orchid Coinmarketcap ranking – #335
OXT/USD Market
Key Levels:
Resistance levels: $0.080, $0.085, $0.090
Support levels: $0.045, $0.040, $0.035
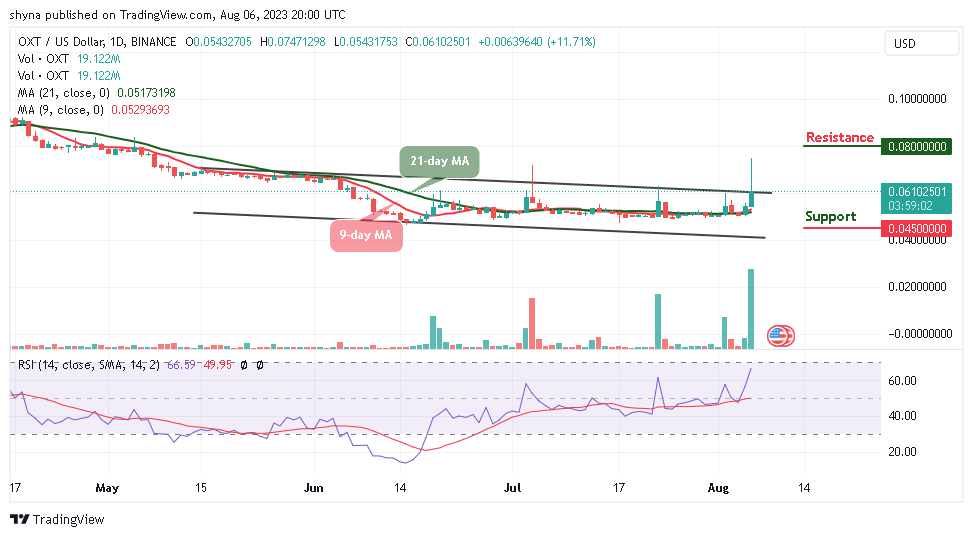
OXT/USD is running a little retracement move above $0.061 with price growth of 11.7%. As the coin is recording some gain, the Orchid price may create additional gains within the channel if it crosses above the upper boundary of the channel. Meanwhile, traders can expect the price to continue to rise if the bulls put more pressure on the market.
Orchid Price Prediction: Orchid (OXT) May Move Upside
The Orchid price hovers above the 9-day and 21-day moving averages of around $0.061. However, if the price begins to create a bullish movement, traders can then expect a bullish continuation above the channel. Nevertheless, as the technical indicator Relative Strength Index (14) spikes above the 60-level, the possible resistance levels could be found at $0.080, $0.085, and $0.090 in the long term.
However, if the coin follows the bullish movement for the next few days, traders may witness more of it reaching higher levels. Moreover, the Orchid price is trying to create a bullish movement in the short term. On the contrary, any bearish movement towards the south could roll the coin back to the long-term support at $0.045, $0.040, and $0.035 levels.
Against Bitcoin, Orchid continues to follow the sideways movement but sliding below the 9-day and 21-day moving averages. However, with the look of things, there is a need for an increasing volume and resistance to cause an upsurge in the market. At the moment, Orchid (OXT) is trading around the 207 SAT. Therefore, traders can expect close support at 150 SAT and below.

However, if a bullish move pushes the price above the channel; traders can confirm a bull run for the coin. The closest resistance could be located at 280 SAT and above as the technical indicator Relative Strength Index (14) moves to cross into the overbought region, suggesting bullish movement.
Alternatives to Orchid
The Orchid bulls are now pushing the coin toward the upper boundary of the channel as the technical indicator Relative Strength Index (14) reveals that the market may embark on a positive movement while the signal line moves to cross into the overbought region.
However, Wall Street Memes is a meme coin borne out of the WallStMemes Web2 internet phenomenon which aims to create a decentralized movement that challenges the status quo and puts the control back into the hands of the people. Nevertheless, almost $21 million has been raised so far .
New OKX Listing - Wall Street Memes

- Established Community of Stocks & Crypto Traders
- Featured on Cointelegraph, CoinMarketCap, Yahoo Finance
- Rated Best Crypto to Buy Now In Meme Coin Sector
- Team Behind OpenSea NFT Collection - Wall St Bulls
- Tweets Replied to by Elon Musk
Join Our Telegram channel to stay up to date on breaking news coverage