
Join Our Telegram channel to stay up to date on breaking news coverage
The Orchid price prediction shows that OXT may cross above the 9-day and 21-day moving averages as the coin begins the upward movement.
Orchid Prediction Statistics Data:
- Orchid price now – $0.059
- Orchid market cap – $57 million
- Orchid circulating supply – 962.6 million
- Orchid total supply – 1 billion
- Orchid Coinmarketcap ranking – #340
OXT/USD Market
Key Levels:
Resistance levels: $0.075, $0.080, $0.085
Support levels: $0.045, $0.040, $0.035
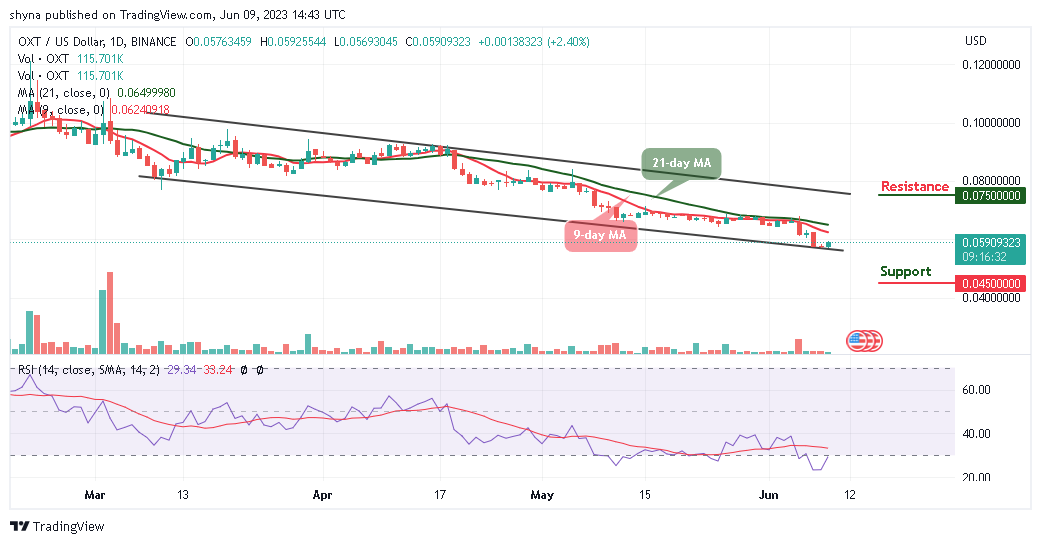
OXT/USD is currently trading at $0.059 and it’s likely to climb above the 9-day and 21-day moving averages if the buyers put in more effort. However, in case the buyers were able to push the price above the resistance level of $0.060, the daily candlestick may close above this level, and the price could rally toward the upper boundary of the channel.
Orchid Price Prediction: Orchid Could Rally to the Upside
Looking at the daily chart, the Orchid price is moving close to the resistance level of $0.060 as the coin prepares to create an additional gain. The technical indicator Relative Strength Index (14) is also moving to cross above the 30-level with the signal line pointing up to indicate a buy signal.
Nevertheless, if the buyers were able to push the price above the moving averages, the Orchid price may rally toward the upper boundary of the channel to hit the potential resistance levels of $0.075, $0.080, and $0.085 while crossing below the lower boundary of the channel could bring the coin to the supports at $0.045, $0.040, and $0.035 respectively.
Against Bitcoin, the Orchid is also following a bullish movement, and it may swing high to cross above the upper boundary of the channel which could locate the resistance level of 270 SAT and above. On the other hand, if the market price crosses below the lower boundary of the channel, it could reach the support level of 170 SAT and below.
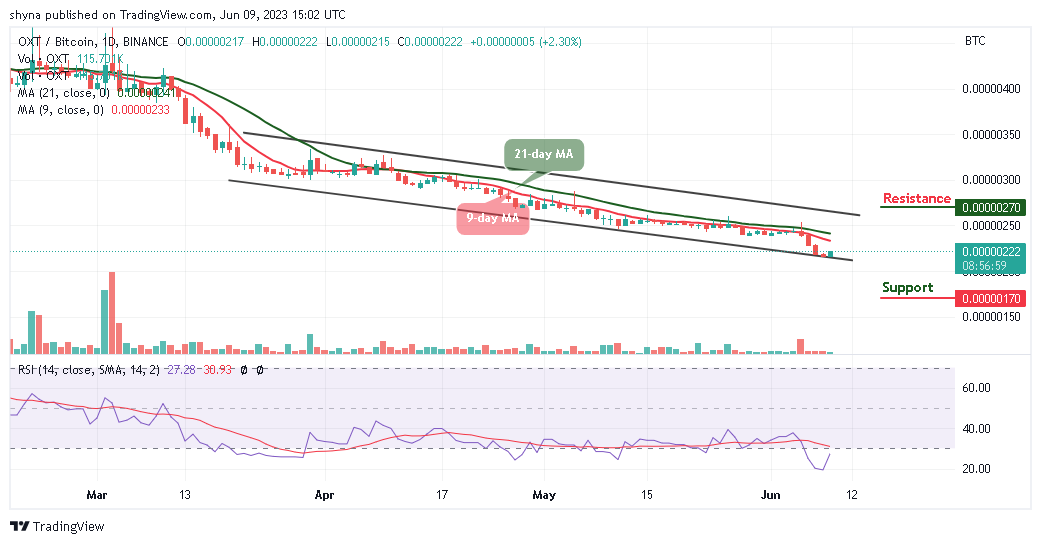
However, the technical indicator Relative Strength Index (14) is currently moving toward the 30-level from the oversold region as the signal line points to the north to confirm the bullish movement. Moreover, any further bullish movement may create additional gains above the moving averages.
Alternatives to Orchid
At the time of writing, the Orchid price is likely to trend to the upside and a bullish movement above the upper boundary of the channel may likely push the coin to the upside. However, the Orchid will have to cross above the 9-day and 21-day moving averages in other to guide against the downward pressure. However, given the sheer scale of the Wall Street Memes community, it’s no surprise that it has attracted attention from influential figures who recognize the power of meme-driven movements. Meanwhile, there has already been close to $6 million raised during the presale.
Read more:
- Ethereum Price Prediction – ETH/USD May Consolidates Between $300 and $335
- Litecoin Price Analysis: The Litecoin (LTC) Plunges but with a Bullish Feeling
- Bitcoin Price Prediction: Bitcoin (BTC) Begins an Important Breakout, Fluctuates Between $9,400 and $9,800
New OKX Listing - Wall Street Memes

- Established Community of Stocks & Crypto Traders
- Featured on Cointelegraph, CoinMarketCap, Yahoo Finance
- Rated Best Crypto to Buy Now In Meme Coin Sector
- Team Behind OpenSea NFT Collection - Wall St Bulls
- Tweets Replied to by Elon Musk
Join Our Telegram channel to stay up to date on breaking news coverage