Join Our Telegram channel to stay up to date on breaking news coverage
The Orchid price prediction reveals that OXT could still follow the bullish movement, despite the recent price falls that hit the market.
Orchid Prediction Statistics Data:
- Orchid price now – $0.096
- Orchid market cap – $69.6 million
- Orchid circulating supply – 690.6 million
- Orchid total supply – 1 billion
- Orchid Coinmarketcap ranking – #357
OXT/USD Market
Key Levels:
Resistance levels: $0.120, $0.130, $0.140
Support levels: $0.080, $0.070, $0.060
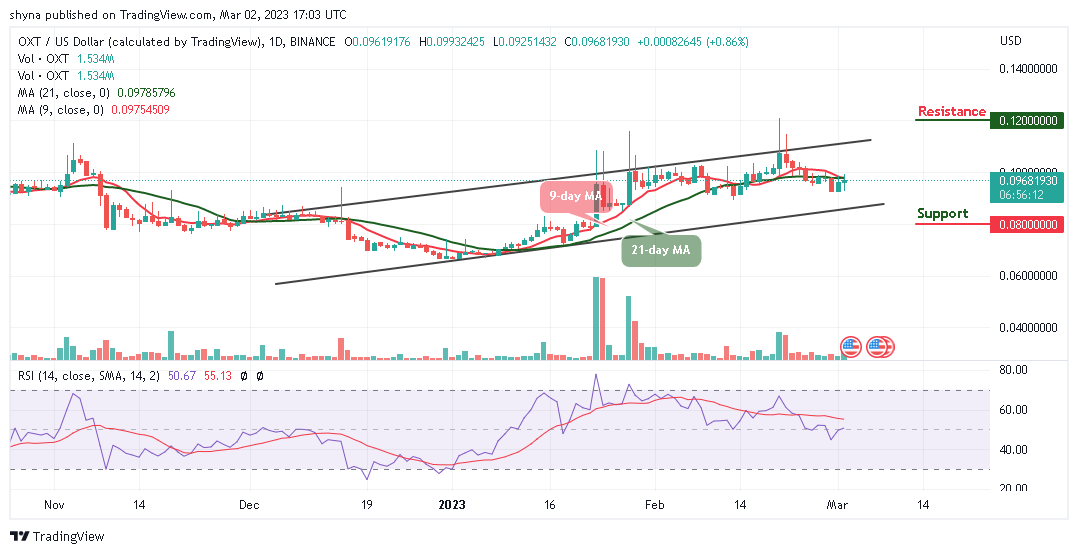
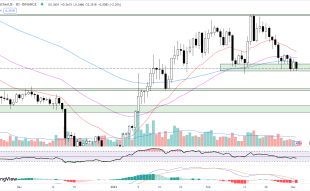
OXT/USD is likely to hold a gain above the 9-day and 21-day moving averages as the price faces the resistance level of $0.100. At the time of writing, the Orchid price is recovering above $0.090, and the coin could start a bullish movement which could lead to the main resistance level at $0.110.
Orchid Price Prediction: Would Orchid Hold Above $0.110?
According to the daily chart, the Orchid price is currently hovering at the resistance level of $0.096 and the initial support could still be created below the previous low at $0.092. Once the coin eliminated this level, the sell-off may begin with the next focus on the $0.090 level. Therefore, if this support level drops further, the downward momentum could begin to snowball, and the next closest supports may be located at $0.080, $0.070, and $0.060.
According to the daily chart, bulls must realize the need to head toward the upper boundary of the channel before they can get to the potential resistance levels. Above this barrier, traders may need to consider a sustained move for the extended recovery to the resistance levels of $0.120, $0.130, and $0.140. Meanwhile, the technical indicator, the Relative Strength Index (14), is moving to cross above the 50-level, which could give additional bullish signals, and this may be possible if the 9-day moving average remains above the 21-day moving average.
Against Bitcoin, buyers are making effort to step back into the market as the coin is showing some promising signs toward the upside. Looking at the daily chart, if the price crosses above the upper boundary of the channel, the nearest resistance level could be located at 500 SAT and above.
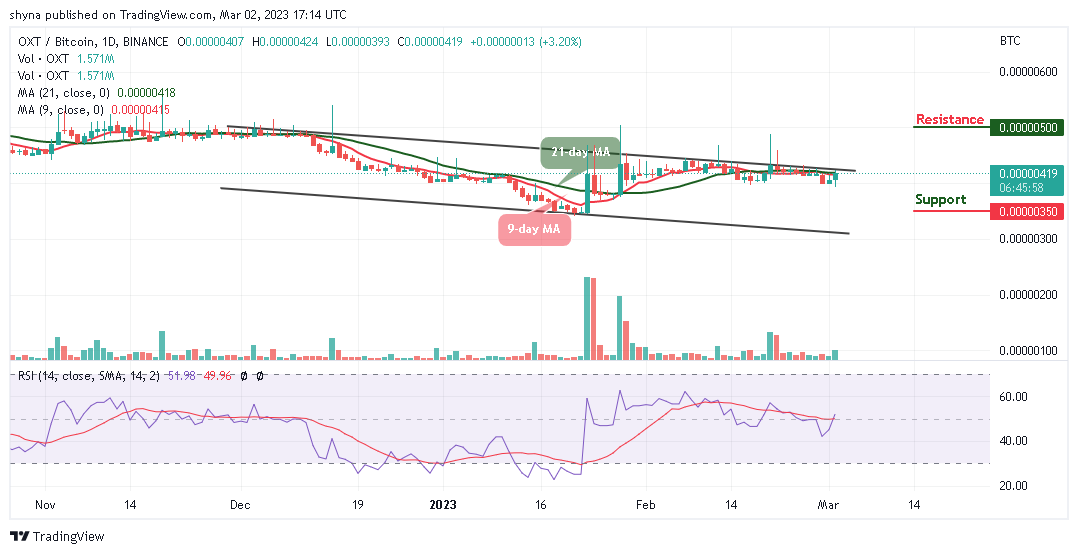
However, when looking from the downside, the nearest support level is below the 9-day moving average at 400 SAT. Therefore, any bearish movement beneath this may reach another support at 380 SAT. If the price drops further to create another low, lower support is located at 350 and below. The Relative Strength Index (14) moves to cross above the 50-level which indicates that the market may follow the bullish movement.
Orchid Alternatives
The Orchid price from the look of things may continue its bullish movement if the buyers should aggressively increase their activities in the market. The coin might turn upside further to a $0.100 high level and beyond. However, the adoption and use of the FightOut platform are one of the main factors influencing the price of FGHT. As more users participate and earn rewards from the FGHT token, the demand for the token is likely to increase. This, in turn, could drive up the price. Meanwhile, there has already been close to $5.5 million raised during the FGHT presale.
Join Our Telegram channel to stay up to date on breaking news coverage