Join Our Telegram channel to stay up to date on breaking news coverage
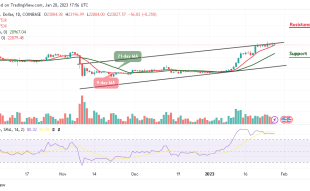
The Orchid price prediction shows that OXT is attempting to cross above the upper boundary of the channel to hit the higher resistance.
Orchid Prediction Statistics Data:
- Orchid price now – $0.10
- Orchid market cap – $69.6 million
- Orchid circulating supply – 690.6 million
- Orchid total supply – 1 billion
- Orchid Coinmarketcap ranking – #319
OXT/USD Market
Key Levels:
Resistance levels: $0.13, $0.14, $0.15
Support levels: $0.07, $0.06, $0.05
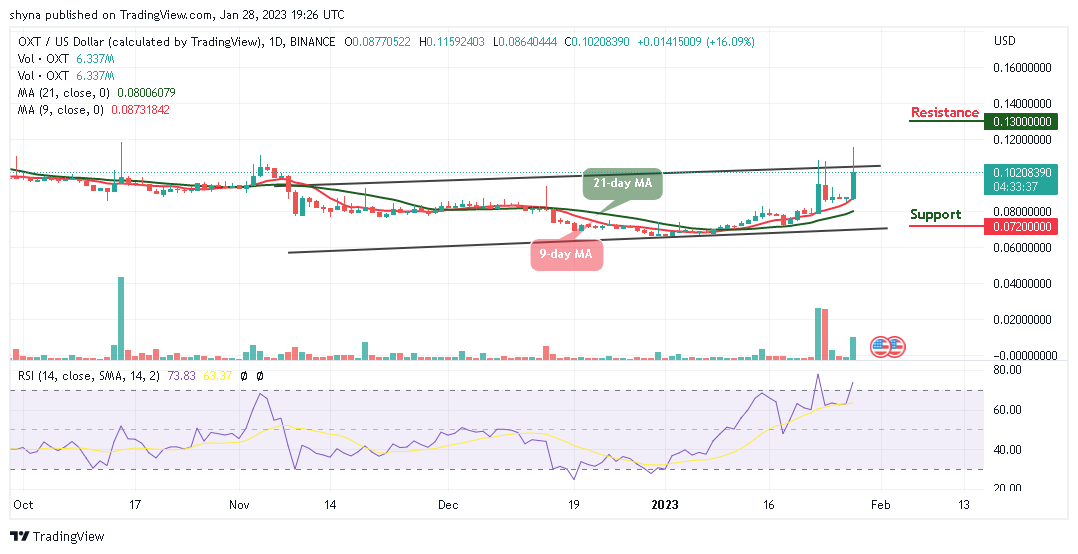
OXT/USD peaks at $0.11 today, after which the coin begins to retreat from the upside. Meanwhile, the Orchid price not staying above $0.11 may ruin the long-term technical picture of the coin. However, the Orchid will have to stay above the 9-day and 21-day moving averages in other to guide against the downward pressure while the closest support expects the coin at $0.10, which could be a daily low.
Orchid Price Prediction: Orchid Likely to Hit $0.12 High
At the time of writing, the Orchid price is likely to trend to the upside and a bullish movement above the upper boundary of the channel may likely push the coin to the resistance levels of $0.13, $0.14, and $0.15. On the downside, a bearish movement below the 9-day and 21-day moving averages could stop the initial upward movement and create bearish momentum with the focus to bring the market to the next support levels of $0.07, $0.06, and $0.05 respectively.
At the moment, the technical indicator Relative Strength Index (14) crosses into the overbought region, which indicates that the market may follow an uptrend. Looking at the daily chart, the 9-day moving average remains above the 21-day moving average which could allow the buyers to concentrate on stirring action to the north.
Against Bitcoin, the Orchid is rising well above the 9-day and 21-day moving averages. Meanwhile, following the recent positive sign, the OXT price may go higher if the buyers sustain the pressure further.
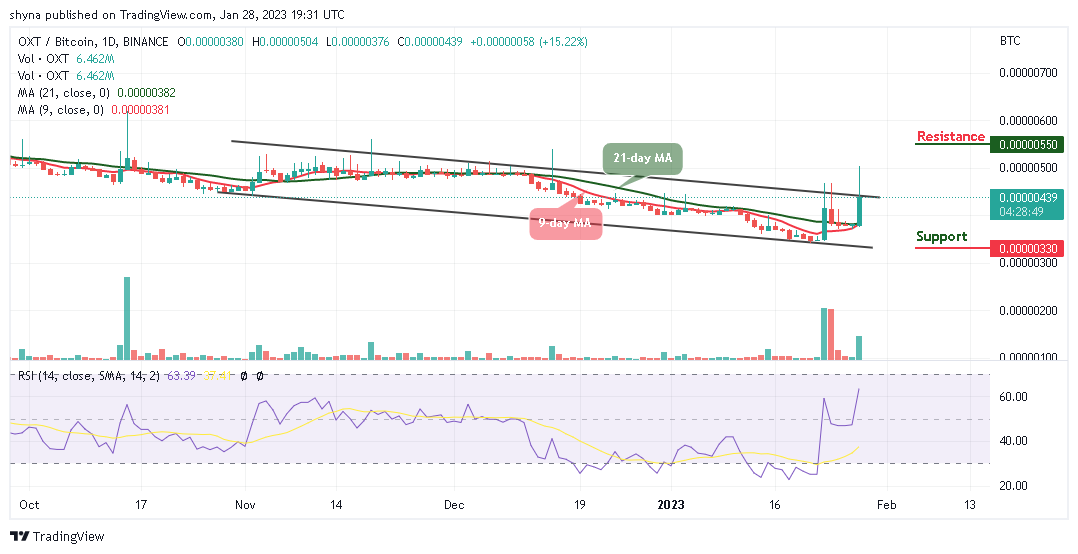
However, if the bears succeeded in breaking below the moving averages, the market price could reach the support level at 330 SAT and below. Meanwhile, a positive move could allow the coin to go above the upper boundary of the channel and push the price to the resistance level of 550 SAT and above. On that note, the technical indicator Relative Strength Index (14) is crossing above the 60-level, suggesting additional bullish signals into the market.
Orchid Alternatives
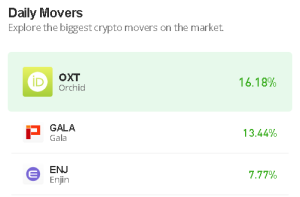
Orchid is one of the trending coins in the market at the moment. It is currently trading at $0.102 after touching the daily high of $0.115. Therefore, there is a need for buyers to keep pushing the coin to the upside. However, there is another coin in the market that benefits traders, the Meta Masters Guild (MEMAG) token is this year’s Play-to-Earn guild with the fastest growth. As a result, it will be Web3’s largest mobile gaming guild. It is possible to develop games that are entertaining and intriguing and work with NFTs. And there, community members receive rewards for their investments and speculation. There has already been close to $2 million raised during the MEMAG presale.
Join Our Telegram channel to stay up to date on breaking news coverage