Join Our Telegram channel to stay up to date on breaking news coverage
The Bitcoin price prediction shows that BTC indicates bearish momentum as further upside got rejected within the channel.
Bitcoin Prediction Statistics Data:
- Bitcoin price now – $23,027
- Bitcoin market cap – $443.7 billion
- Bitcoin circulating supply – 19.2 million
- Bitcoin total supply – 19.2 million
- Bitcoin Coinmarketcap ranking – #1
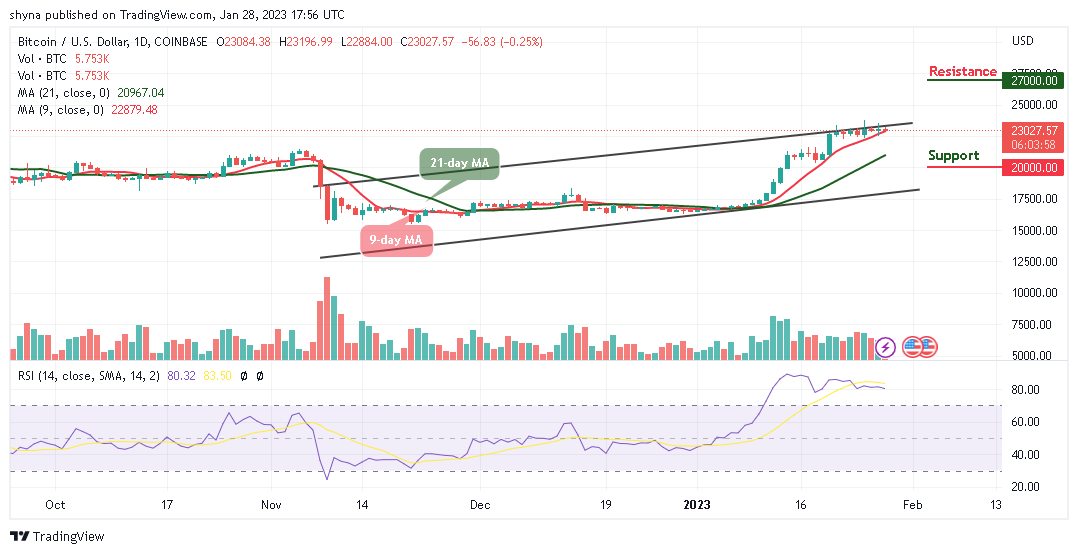
BTC/USD Long-term Trend: Ranging (Daily Chart)
Key levels:
Resistance Levels: $27,000, $29,000, $31,000
Support Levels: $20,000, $18,000, $16,000
At the time of writing, BTC/USD is hovering at $23,027. A few hours ago, the Bitcoin price exchange hands below $23,196 to sustain the bearish price action. However, the current market movement is still sideways, and the daily chart shows that the formation of a bearish may likely come to play.
Bitcoin Price Prediction: BTC May Head to the Downside
Looking at the technical indicator, the Relative Strength Index (14) is moving within the overbought region as Bitcoin price prepares for the bearish movement. With the look of things, BTC/USD is likely to cross below the red line of the 9-day moving average. This could mean that the king coin may follow the downward movement as soon as the coin crosses below the 21-day moving average.
In other words, recovery may not come easy but a sustainable move above the upper boundary of the channel may locate the potential resistance levels at $27,000, $29,000, and $31,000. Meanwhile, an increase in selling pressure across the market could force the Bitcoin price to follow a painful path which could locate the supports at $20,000, $18,000, and $16,000 respectively.
BTC/USD Medium-term Trend: Ranging (4H Chart)
Looking at the 4-hour chart, the Bitcoin price is currently moving within the 9-day and 21-day moving averages touching the low of $22,982 support. Looking at the chart, the Bitcoin price is not yet sure whether it could return to the bull market as the technical indicators keep ranging. However, if the price moves toward the north, higher resistance could be located at $25,000 and above.
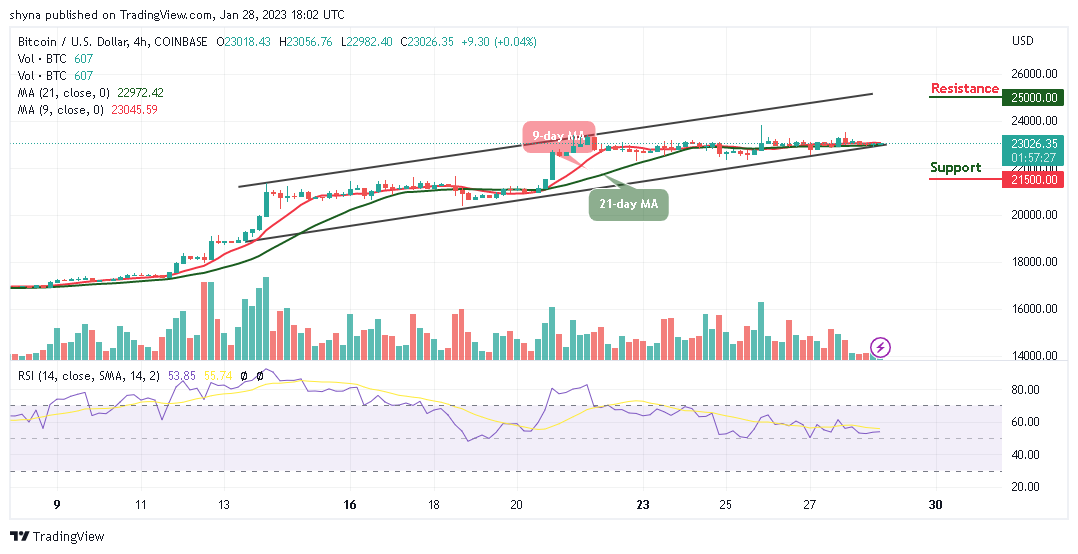
At the moment, as the technical indicator, Relative Strength Index (14) moves in the same direction above the 60-level, the support level of $21,500 and below may come to play. Moreover, BTC/USD is likely to fall more if the price crosses below the lower boundary of the channel.
Bitcoin Alternatives
The Bitcoin price is consolidating gains at the moment and might begin another increase towards $23,500 if bulls increase the buying pressure. On that note, there is another coin in the market that is giving high returns on investment, the Meta Masters Guild (MEMAG) token benefits traders. This token is this year’s Play-to-Earn guild with the fastest growth. As a result, it will be Web3’s largest mobile gaming guild. It is possible to develop games that are entertaining and intriguing and work with NFTs. And there, community members receive rewards for their investments and speculation. There has already been close to $2 million raised during the MEMAG presale.
Join Our Telegram channel to stay up to date on breaking news coverage