Join Our Telegram channel to stay up to date on breaking news coverage
The Bitcoin price prediction is falling again in a narrow channel, but buying interest could pick up if the price approaches $23,500.
Bitcoin Prediction Statistics Data:
- Bitcoin price now – $22,921
- Bitcoin market cap – $442.2 billion
- Bitcoin circulating supply – 19.2 million
- Bitcoin total supply – 19.2 million
- Bitcoin Coinmarketcap ranking – #1
BTC/USD Long-term Trend: Bearish (Daily Chart)
Key levels:
Resistance Levels: $26,500, $27,500, $28,500
Support Levels: $20,000, $19,000, $18,000
During the European session today, BTC/USD begins the day with the resistance level of $23,011 and it is likely to drop below the 9-day moving average if the bears increase the selling pressure. However, the psychological barrier of $23,500 still serves as the first important resistance within the market and a sustainable move above the upper boundary of the channel may likely take the price to the resistance level of $24,000.
Bitcoin Price Prediction: Will Bitcoin (BTC) Head to the Upside?
The Bitcoin price is seen hovering above the 9-day and 21-day moving averages. However, with the look of things, it is likely for the king coin to break below the 9-day moving average, which may increase the selling pressure. At the time of writing, BTC/USD is hovering at $22,921 and if this is cleared, the dips to $21,500 are likely to be bought, which means the overall bullish sentiments may prevail.
However, if the price moves below the mentioned support, $21,000 could come into focus which served as support during the previous consolidation period while the critical supports could be found at $20,000, $19,000, and $18,000. Looking at the upside, the first resistance may likely come at $24,000 if the king coin rebounded. Once this is done, $25,000 could come back into focus. Further bullish movement may hit the potential resistance levels at $26,500, $27,500, and $28,500 as the Relative Strength Index (14) moves within the overbought region.
BTC/USD Medium-term Trend: Ranging (4H Chart)
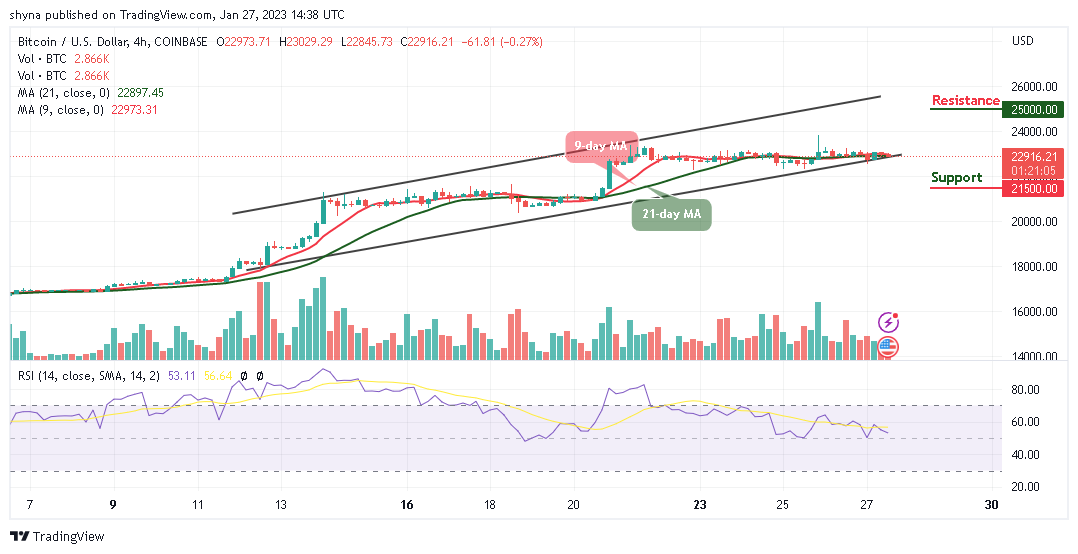
The 4-hour chart shows that the Bitcoin bears are still in play within the market keeping the Bitcoin price below the 9-day and 21-day moving averages. Although BTC/USD has not yet slipped below $22,000, it’s still in the loop of making a bounce back.

However, the Bitcoin price is moving sideways at the time of writing but the upward movement could push the price to the resistance of $25,000 and above while the immediate support lies at $21,500 and below. The Relative Strength Index (14) is moving below the 60-level, which indicates bearish movement.
Bitcoin Alternatives
Bitcoin is the most popular cryptocurrency in the world, and it is a great investment for those who are interested in it. Nonetheless, there is another great means of investment which has huge potential. That is Meta Masters Guild (MEMAG). MEMAG token is the Play-to-Earn guild that has grown the rapidly in 2023. It will eventually be the most popular mobile gaming guild on Web3. It enables interesting and fun-filled video games that utilize NFTs. Those in the community are compensated for their investments and speculation. During the MEMAG presale, around $2 million has already been raised.
Join Our Telegram channel to stay up to date on breaking news coverage


