Join Our Telegram channel to stay up to date on breaking news coverage
ETH Price Prediction – July 28
ETH/USD has been trying to keep its upward movement while the bears are seen as frustrating the movement.
ETH/USD Market
Key Levels:
Resistance levels: $360, $370, $380
Support levels: $280, $270, $260

ETH/USD is currently trading at $315 after a strong breakout. Ethereum price has been remarkably slow in its movement since yesterday. Meanwhile, a little progress has been made from the time that the coin hit the new year highs at $334, buyers have been keen on holding the price above $320 but the coin is now reversing towards the south. The lethargic movement follows a lower correction from highs around $320.26 and the failure to break above this level must have discouraged the bulls while giving Ethereum bears a gap to explore.
However, the 9-day moving average on the daily chart came out as strong support. This move allowed ETH/USD to push for reversal above the upper boundary of the channel but the upside is limited under $350. At the moment, the intraday chart reveals that the bears are trying to step back into the market with a current movement coming to touch the red-line of the 9-day moving average, heading towards the support level of $300.
Moreover, for a backward movement, the market can be supported at levels of $280 and $270 and if the price falls below the previous levels, another support is around $260. But should in case the price exceeds the indicated level, then, the resistance levels of $360, $370, and $380 may be visited. The RSI (14) is now preparing to leave the overbought while the trading volume is becoming low.
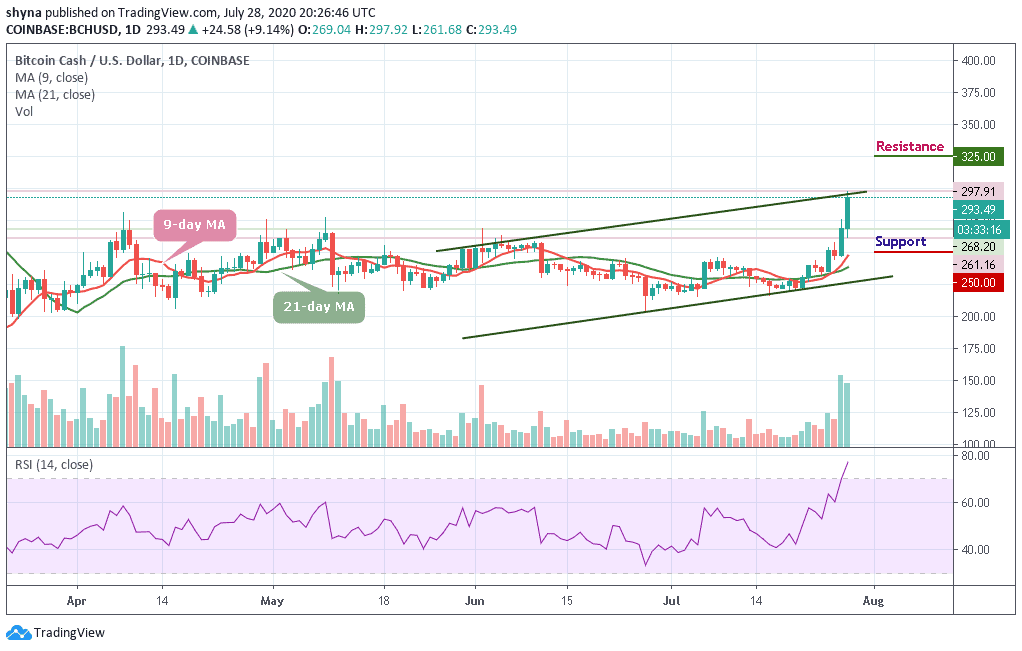
Comparing it with Bitcoin, it was discovered a few days ago that ETH/BTC pair broke down significantly to touch the red-line of the 9-day moving average, after which the market couldn’t maintain the uptrend again. Today, the price started falling and it is also reflecting on the RSI (14) as the signal line is about to cross below the 60-level, which might confirm a bearish sign for the market.
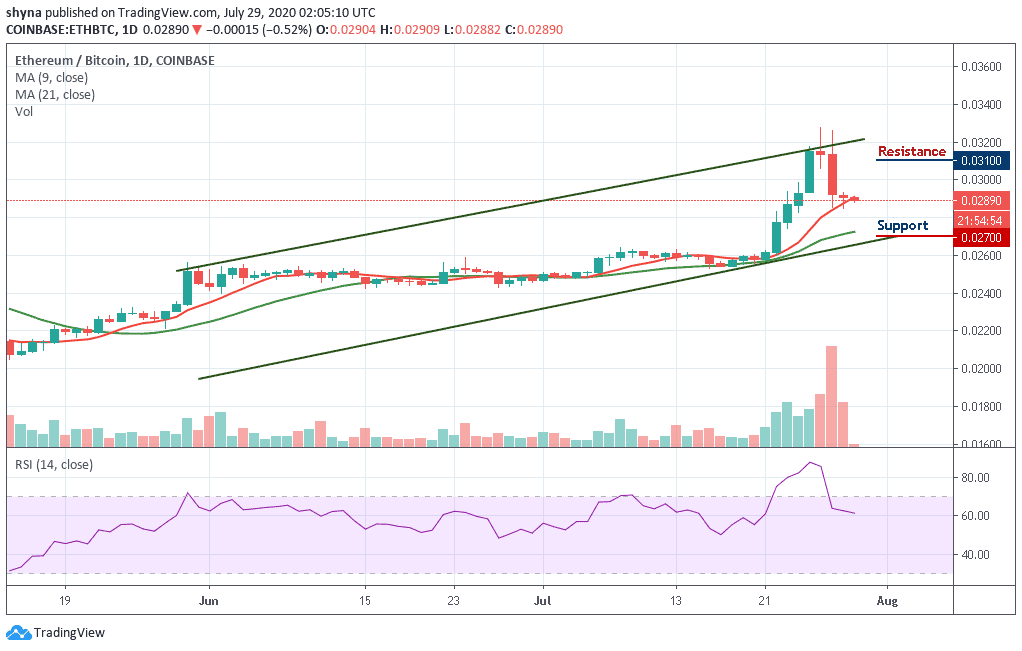
Moreover, the market price may continue to decline if the sellers put more effort to bring it down to the support levels of 2700 SAT and below. Therefore, as it is now, the price of Ethereum is likely to go up as high as 3100 SAT and above as soon as the RSI turns upward.
Join Our Telegram channel to stay up to date on breaking news coverage