Join Our Telegram channel to stay up to date on breaking news coverage
BCH Price Prediction – July 28
The Bitcoin Cash (BCH) is riding the bulls on the daily chart as the traders are expected to have a great week ahead.
BCH/USD Market
Key Levels:
Resistance levels: $325, $335, $345
Support levels: $250, $240, $230
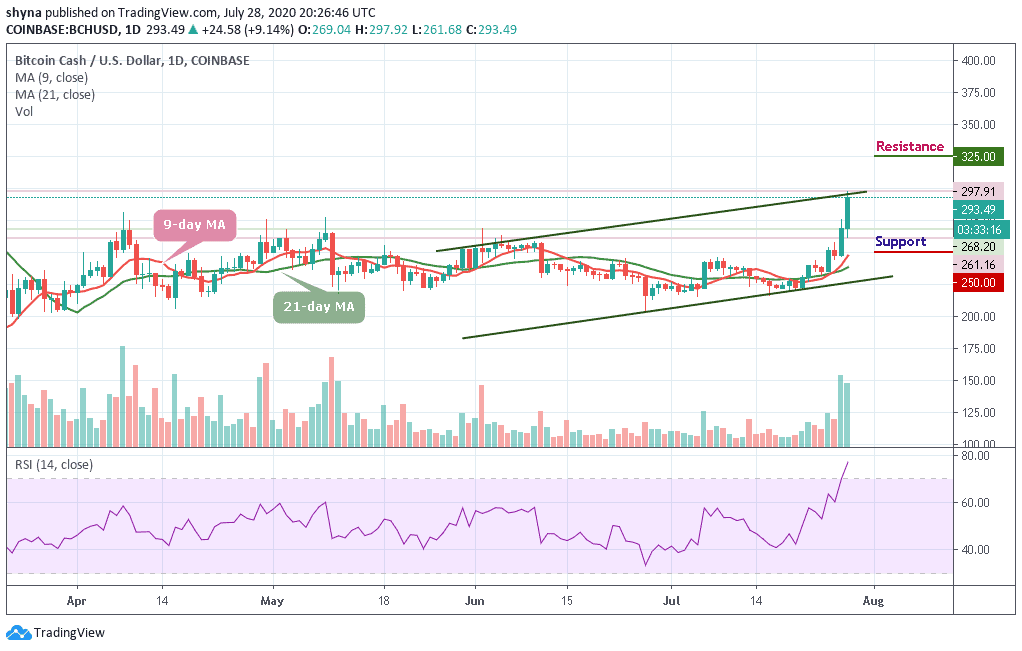
BCH/USD bulls today makes an attempt to crack the resistance of $300 but got rejected at $297.91. However, the coin is trading at $293.49 at the time of writing. The price is also moving around the upper boundary of the channel. The technical indicator also points towards continued bullish action. It is only a matter of minutes before the bulls take down the resistance at $300 and shift the focus to $320.
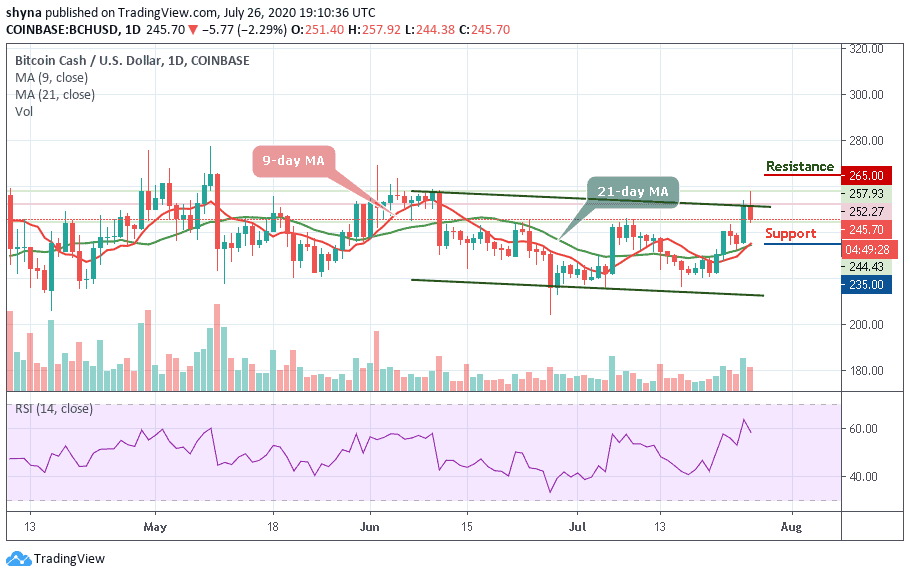
However, BCH/USD price has continued to consolidate itself in a flag formation, waiting for a potential breakout. The daily chart shows us that BCH/USD had dropped slightly to $261.16 which is above the moving averages after bouncing to $297.91 level. Meanwhile, if the support gets weak, a price break-down may occur as the bears may find new lows at $250, $240, and $230 support levels.
Moreover, a bullish continuation may likely roll the market to $300 resistance with a possible break out of the channel and move towards the $325, $335, and $345 resistance levels, creating a new monthly high for the market. At the moment, the RSI (14) indicator is within the overbought zone, revealing more buy signals for the market.
Comparing with BTC, the market begins the uptrend journey a few hours ago to move above the 9-day and 21-day moving averages. For the past 2days, BCH focused on the downward trend by testing the 2400 SAT. But today, the coin signaled a bullish rally, likely to meet resistance at 2800 SAT and 2900 SAT if pressure rises.
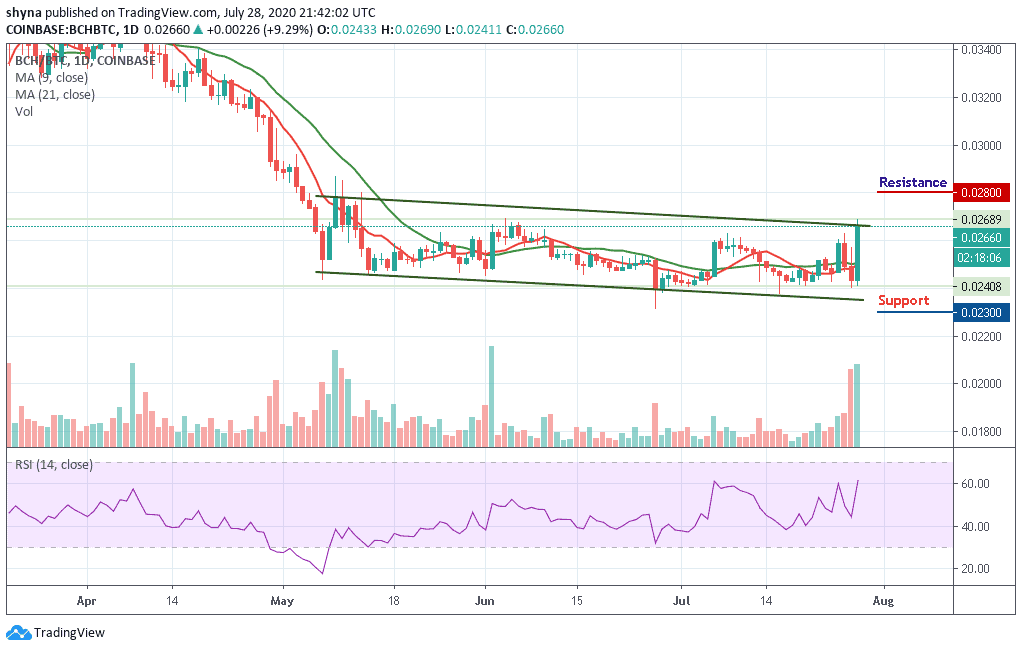
Meanwhile, from the market structure, we can say the bulls have regained control of the market as the RSI (14) is now rising within the overbought territory. BCH/BTC is likely to retrace to the break level around 2660 SAT where it is consolidating. Meanwhile, should BCH drops below the moving averages, the price may find support at 2300 SAT and 2200 SAT respectively.
Join Our Telegram channel to stay up to date on breaking news coverage