Join Our Telegram channel to stay up to date on breaking news coverage
Bitcoin (BTC) Price Prediction – July 28
Looking at it technically, the Bitcoin bulls may hit the pause button after a move above $11,000.
BTC/USD Long-term Trend: Bullish (Daily Chart)
Key levels:
Resistance Levels: $11,800, $12,000 $12,200
Support Levels: $10,500, $10,300, $10,100
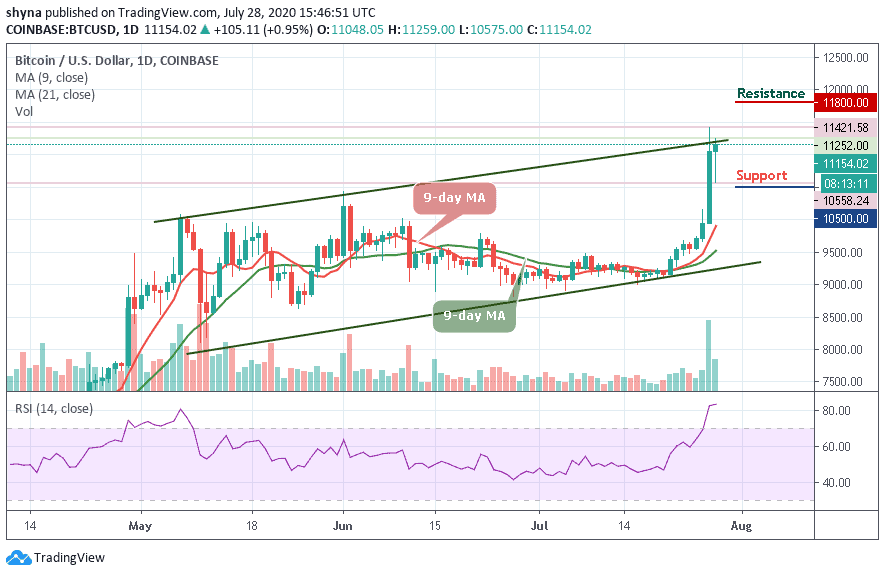
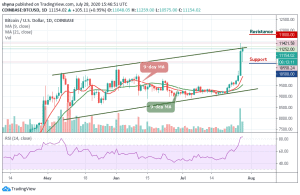
BTC/USD bulls are experiencing a euphoric rise in its price where it has broken above the significant resistance levels from $10,000-$10,500 range and currently continues its upswing to a high above $11,200. Considering the market price that is breaking out above the upper boundary of the channel, traders should also be aware of limited gains and a reversal ahead.
At the time of writing, BTC/USD is trading hands at $11,154 amid a short-term bullish trend. On the intraday charts, the coin stays above the 9-day and 21-day moving averages around $10,558, which now serves as a local support area for the coin. If the technical indicator RSI (14) leaves the overbought region and the support of $10,558 is out of the way, the sell-off is likely to gain traction with the next focus at $10,500, $10,300, and $10,100 support levels.
However, there are several important technical barriers below and above the current price. It means that BTC/USD may need to spend some time consolidating gains at the current levels before another attempt to clear the psychological $11,500. Although the bears’ impulse may not be strong enough to pull the big bull below the $10,000 price mark, at least within the next few hours, the bulls will need to maintain the $10,500 mark as the minimum support level or the coin might retest previous support.
Meanwhile, hitting the $11,500 high could happen anytime soon. The next 24hrs may set BTC/USD in motion for $11,800, $12,000 and $12,200 resistance levels. Another thing is that the market price may trade around the $11,000 and $10,000 if the market follows the sideways movement.
BTC/USD Medium-Term Trend: Bullish (4H Chart)
On the 4-hour chart, BTC/USD continued its bullish trend; however, today’s price moves are not that impressive one as it drops below the daily high of $11,252. However, for the past few hours, BTC/USD is still losing its price position trading below $11,000. Meanwhile, the coin could still maintain it’s bull-run and hit the price point above $11,300.
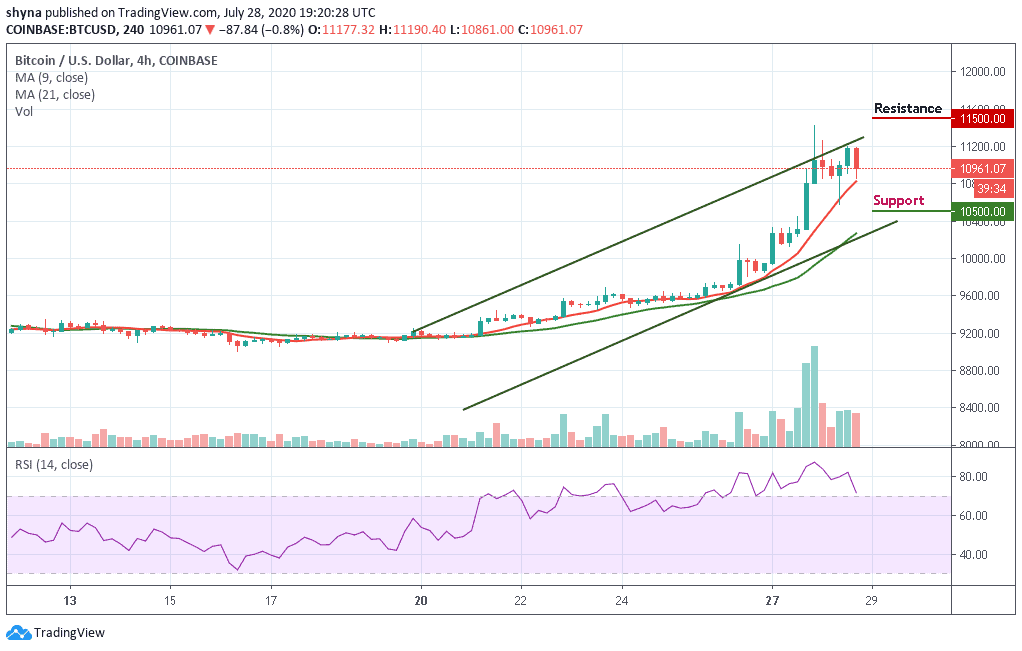
Above the said price mark, BTC couldn’t fight the resistance and it took a downward move. The coin breached major support near $10,950 and reached $10,961. Here, the coin appears to have found decent support as the coin is working on its recovery while tracing a bullish trend line.
The RSI (14) indicator is lowly volatile and making an attempt to move out of the overbought zone; it may see supports at $10,500 and below while the resistance lies at $11,500 and above.
Join Our Telegram channel to stay up to date on breaking news coverage