

Join Our Telegram channel to stay up to date on breaking news coverage
Bitcoin (BTC) Price Prediction – June 6, 2020
Should you buy Bitcoin? Following the upward correction, BTC/USD pair appears to have settled either at $9,500 or $9,600. After the upward correction on June 2, the bulls were repelled at the $9,800 resistance. BTC dropped to $9,600 low. In the last 24 hours, there has been no significant price movement.
Key Levels:
Resistance Levels: $10,000, $11, 000, $12,000
Support Levels: $7,000, $6,000, $5,000

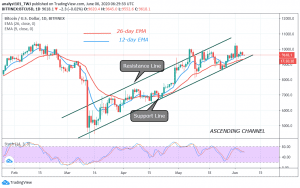
Since the beginning of June, Bitcoin has had a sudden breakout that breached the $10,000 overhead resistance. BTC reached a high of $10,400. On the following day, BTC has an unexpected breakout that plunged the king coin to $9,264 low. Immediately, price corrected upward above $9,400. In the last four days, the crypto has been fluctuating between $9,400 and $9,800. These two levels will determine Bitcoin’s next move. In other words, the coin will decline if the $9,400 support is broken.
In the same vein, BTC will rise if the $9,800 resistance is breached. In May, the upside range between $9,300 and $9,800 was functional because of the presence of volatility. The bulls were unrelenting as they made several retests at the $10,000 overhead resistance. Unfortunately, buyers were unsuccessful in all attempts to break the resistance. Today, BTC is range bound between $9,400 and $9,800. Neither the bulls nor bears have the upper hand. The Relative Strength Index period 14 has fallen to level 46 indicating that price is in the downtrend zone. A further downward movement is expected.
BTC/USD Medium-term Trend: Bullish (4-Hour Chart)
On the 4 hour chart, the bulls and bears are struggling between $9,400 and $9,800 to break their respective levels out of the current range. On the upside range, if buyers are successful above $9,800, the upside range will resume.
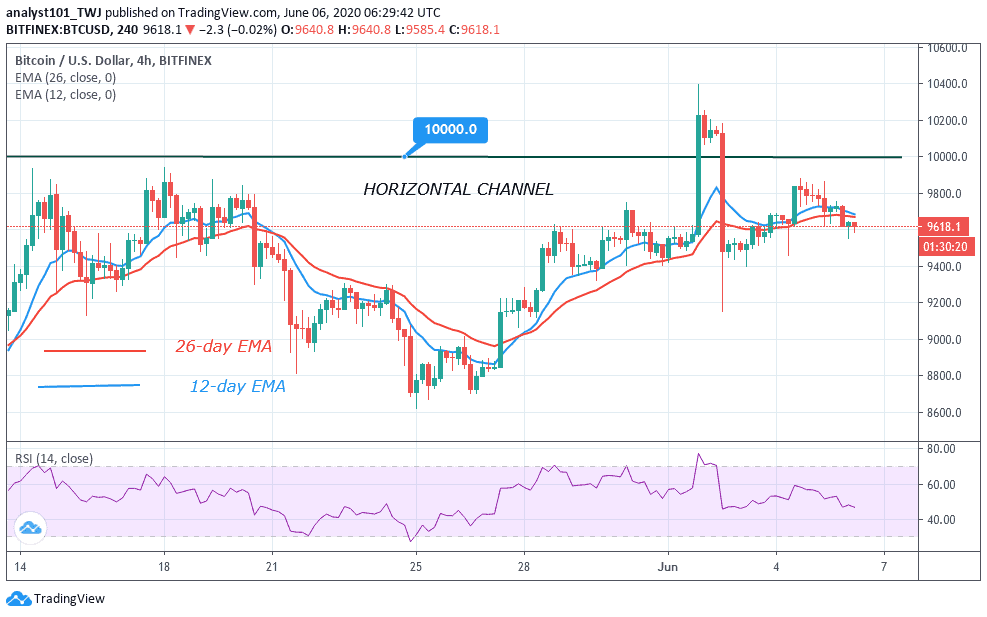
The bulls will attempt to retest the overhead resistance to break it. Already, analysts have expressed optimism that Bitcoin is on the brink of rallying towards $11,000 in the nearest future. On the downside, a break below $9,400 will cause BTC to decline. Meanwhile, BTC is above 60% range of the daily stochastic indicating a bullish momentum.
Please note: Insidebitcoins.com is not a financial advisor. Do your research before investing your funds in any financial asset or presented product or event. We are not responsible for your investing results.
Join Our Telegram channel to stay up to date on breaking news coverage
