Join Our Telegram channel to stay up to date on breaking news coverage
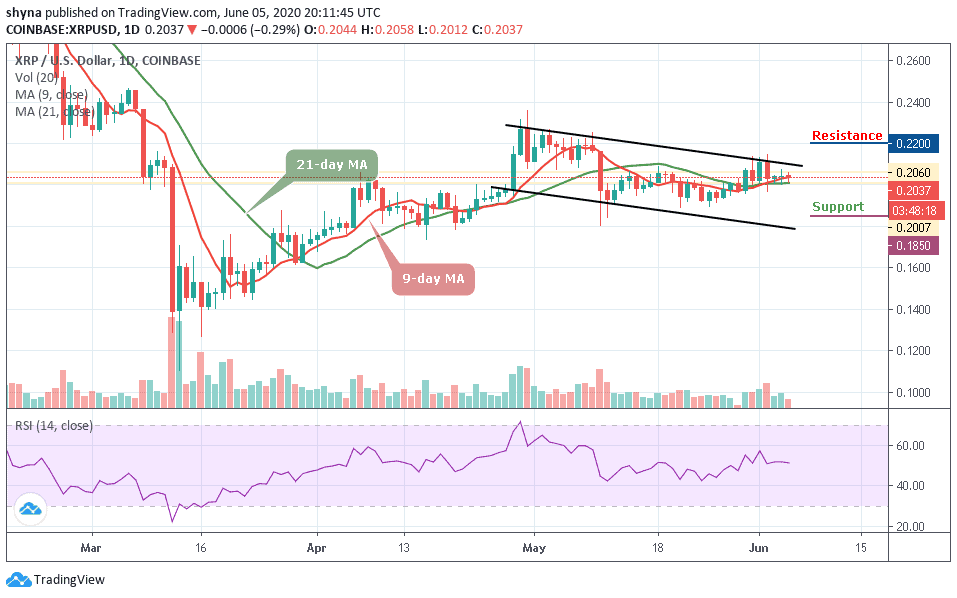
Bitcoin (BTC) Price Prediction – June 5
At the moment, BTC/USD dropped by a total of 1.16% within 24 hours as it trades at $9,674 level.
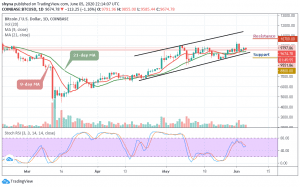
BTC/USD Long-term Trend: Bullish (Daily Chart)
Key levels:
Resistance Levels: $10,700, $10,900, $11,100
Support Levels: $8,800, $8,600, $8,400

The daily chart reveals that BTC/USD failed to break above the previous resistance levels within the ascending channel with the current consolidation pattern. Once again as it fails to close above the $9,700 level, the coin may likely see a sharp drop below the 9-day and 21-day moving averages. Similarly, the first level of support is located below the lower boundary of the channel at $9,200. Beneath this, support lies at $8,800, $8,600 and $8,400 levels.
However, as the daily chart reveals, BTC/USD has failed to break above resistance levels at $10,000, the coin may set up another few days of negative price declines beneath $9,500. A break above the previous level would have set Bitcoin up to retest the $10,000 level. Meanwhile, the technical indicator RSI (14) may follow the sideways movement.
Furthermore, we can clearly see Bitcoin failing to break below the moving averages. Today, the Bitcoin price touches$9,859 but went on to roll over and drop back beneath the $9,800 level. Although the candle is still yet to close, however, it does look unlikely that the bulls may end up closing above this resistance. More so, toward the upside, resistance lies at $10,700, $10,900, and $11,100.
BTC/USD Medium-Term Trend: Bullish (4H Chart)
The 4-hour chart shows that the Bitcoin bears are now stepping back into the market pushing the BTC price below its previous support level that existed around $9,700. Although the Bitcoin price has not yet slipped below $9,500, it’s still in the loop of making a bounce back.
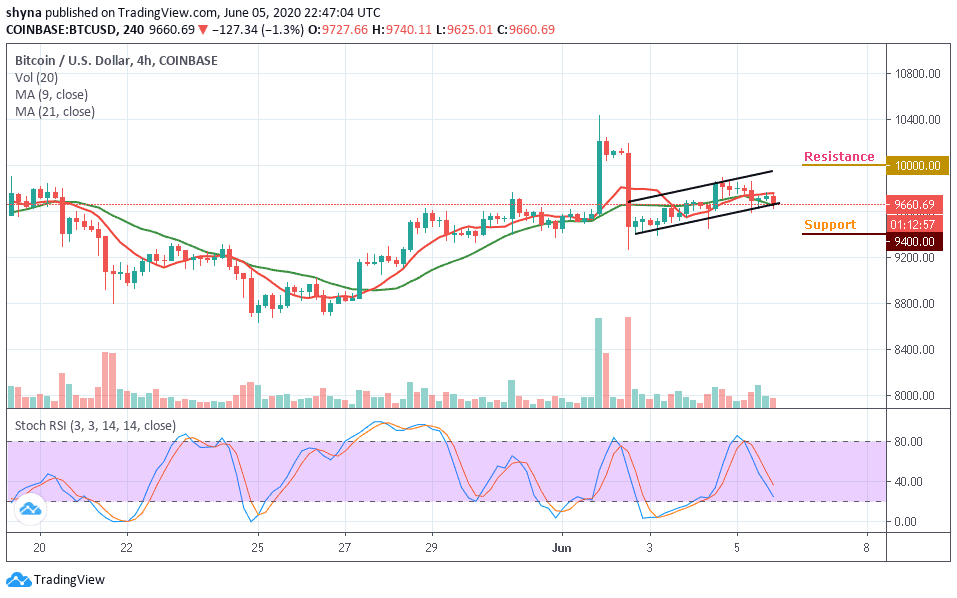
At the moment, BTC/USD is currently moving below the 9-day and 21-day moving averages. The upward movement may likely push the price nearest resistance at $10,000 and above while the immediate support lies at $9,400 and below. The stochastic RSI is focusing on the oversold territory, which indicates more bearish signals.
Please note: Insidebitcoins.com is not a financial advisor. Do your research before investing your funds in any financial asset or presented product or event. We are not responsible for your investing results.
Join Our Telegram channel to stay up to date on breaking news coverage