Join Our Telegram channel to stay up to date on breaking news coverage
XRP Price Prediction – June 5
XRP/USD is dropping with a small 0.29% over the past 24 hours as it falls back into the $0.200 support.
XRP/USD Market
Key Levels:
Resistance levels: $0.220, $0.240, $0.260
Support levels: $0.185, $0.165, $0.145
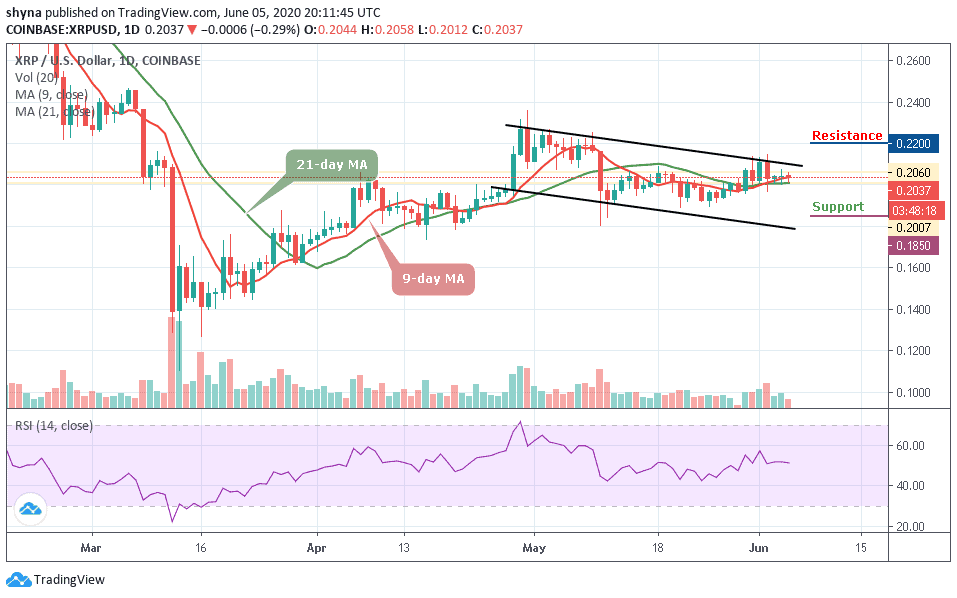
XRP/USD continues to hold strong at $0.200 and this level has been supporting the market since a few days ago. However, it’s possible that the more this support is tested, the more it’s likely to break. If XRP continues to abuse the $0.200 level, we can expect the price to break beneath it at some point and the potential support levels of $0.185, $0.165, and $0.145 may be tested.
At the time of writing, the price is hovering at $0.203 with the weak bullish momentum supported by the 9-day and 21-day moving average. The resistance levels to watch for are $0.220, $0.240, and $0.260. The technical indicator is beginning to slope gradually downwards. However, the bears may remain in control until a larger divergence to the upside is seen.
Comparing with Bitcoin, the Ripple (XRP) has been slowly grinding higher. After bottoming out around the 2080 SAT level, the price began to slowly ascend and is currently trading around the 2092 SAT. XRP’s price is now contained within the descending channel as traders wait for the bulls to hopefully push the price above the 9-day and 21-day moving averages.
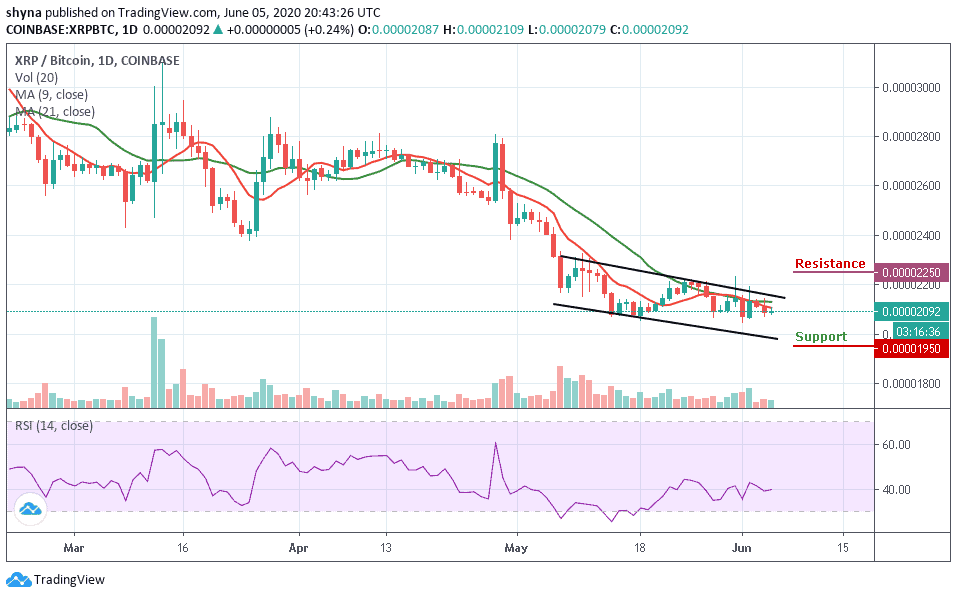
Moreover, if the bulls can break above the upper boundary of the channel, we can expect initial resistance at 2100 SAT. Above this, higher resistance lies at 2250 SAT and above. From below: If the sellers push the market beneath the lower boundary of the channel, we can expect supports at the 1950 SAT and below. The RSI (14) is around the 40-level and is likely to follow a sideways movement.
Please note: Insidebitcoins.com is not a financial advisor. Do your research before investing your funds in any financial asset or presented product or event. We are not responsible for your investing results.
Join Our Telegram channel to stay up to date on breaking news coverage