Join Our Telegram channel to stay up to date on breaking news coverage
Bitcoin (BTC) Price Prediction – June 5
BTC/USD resumes the decline after consolidation in a narrow channel but the buying interest may increase on approach to $9,800.
BTC/USD Long-term Trend: Bullish (Daily Chart)
Key levels:
Resistance Levels: $10,800, $11,000, $11,200
Support Levels: $8,600, $8,400, $8,200
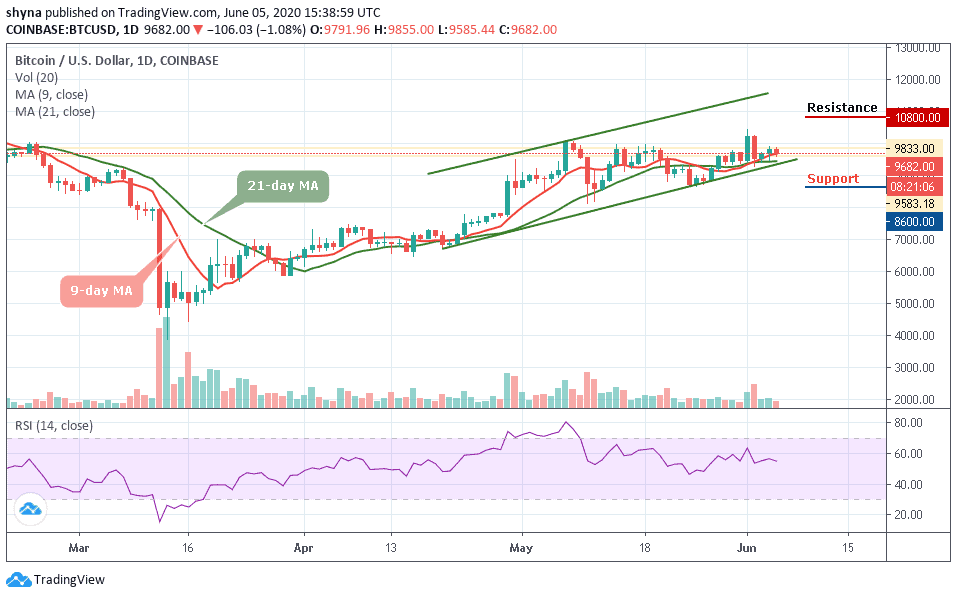
At the early hours of today, BTC/USD touched the high of $9,833 and retreated to $9,682 at the time of writing. The Bitcoin price has been recovering slowly after a volatile start of the week. Meanwhile, the psychological barrier of $10,000 still serves as the first important resistance within the market. More so, a sustainable move above this level may likely push the price towards the weekly high at $10,426 it a bad time to buy Bitcoin.
However, on the intraday chart, BTC/USD breaks below the narrow range of $9,708, which increased the selling pressure. At the time of writing, the price is hovering at the support created by the 9-day moving averages and if this is cleared, the sell-off may be extended to $9,427 which is around the 21-day moving average. In addition, the dips to $9,200 are likely to be bought, which means the overall bullish sentiments may prevail.
Moreover, if the price moves below the mentioned-support, $9,000 could come into focus which served as a support during the previous consolidation period while the critical supports lie at $8,600, $8,400, and $8,200. On the upside, the first resistance may come at $9,900. Once it is clear, $10,000 could come back into focus. Further bullish movement may hit the potential resistance levels at $10,800, $11,000 and $11,200 as the RSI (14) moves around 56-level.
BTC/USD Medium-Term Trend: Ranging (4H Chart)
BTC/USD on 4-hour chat is currently in the ascending range of the medium-term outlook. On the flip side, if $10,000 remains unconquered in the short term, bullish influence could spike. In this case, the accrued gains could be trimmed massively. However, the forming rising triangle pattern could jeopardize tentative support levels at $9,500, and $9,400.
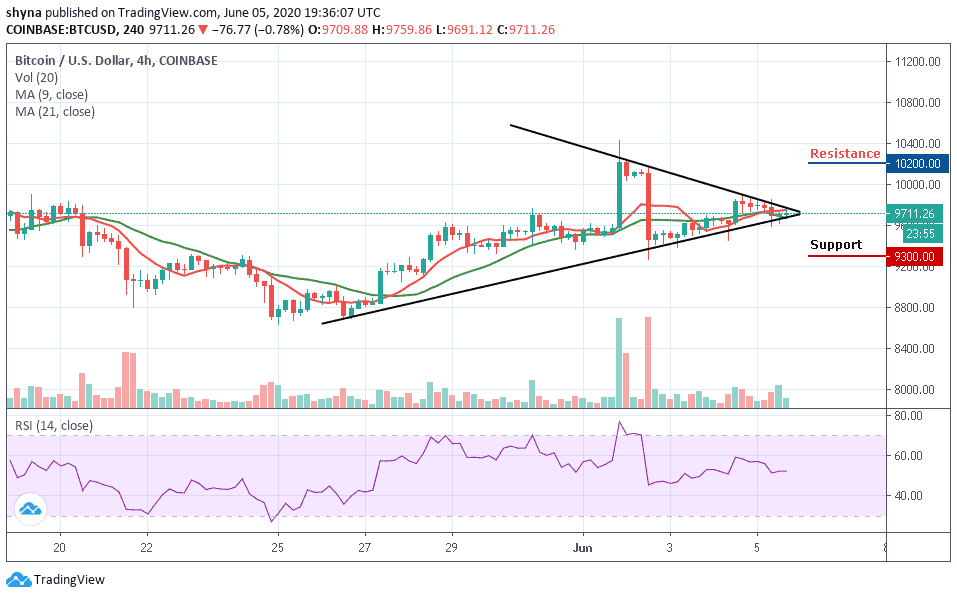
On the downside, the ultimate target is the support at $9,300, $9,100 and $8,900. For now, the best the bulls can do is to hold above the weak support at $9,700 and keep their attention on breaking the resistance at $10,200, $10,400, and $10,600 levels. Meanwhile, the RSI (14) is seen moving around 52-level, which may suggest a sideways movement.
Please note: Insidebitcoins.com is not a financial advisor. Do your research before investing your funds in any financial asset or presented product or event. We are not responsible for your investing results.
Join Our Telegram channel to stay up to date on breaking news coverage