
Join Our Telegram channel to stay up to date on breaking news coverage
The Neo price prediction could spike a significant surge as the price breaks above the resistance level of $13.0.
Neo Price Statistics Data:
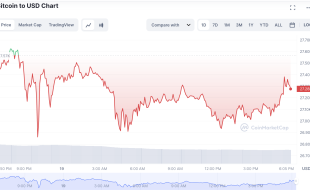
- Neo price now – $12.85
- Neo market cap – $913.8 million
- Neo circulating supply – 70.5 million
- Neo total supply – 100 million
- Neo Coinmarketcap ranking – #57
NEO/USD Market
Key Levels:
Resistance levels: $16.0, $17.0, $18.0
Support levels: $9.5, $8.5, $7.5
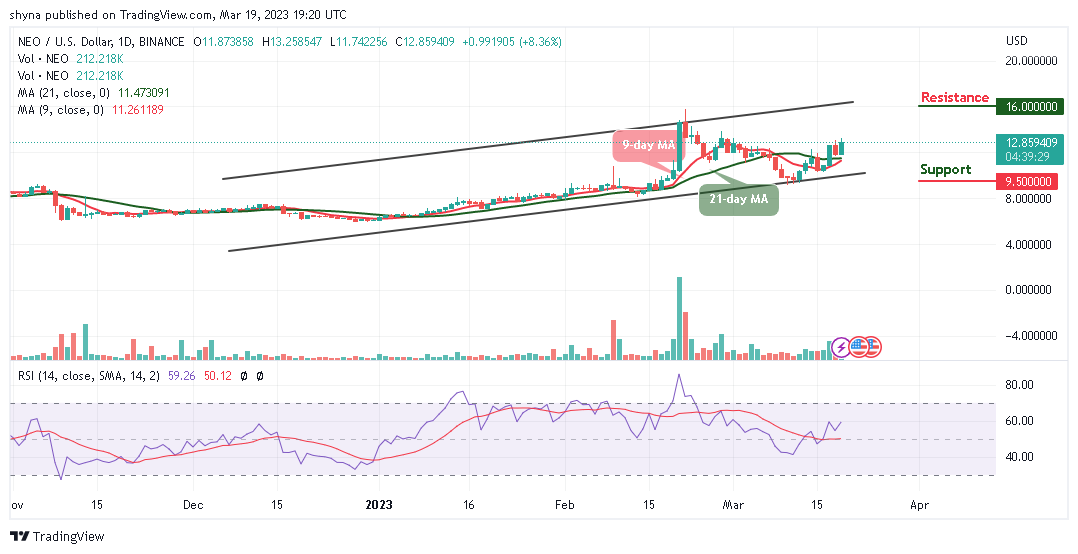
NEO/USD is seen refreshing to a new high as the coin breaches above $13.0 while currently trading at $12.85 with a bullish crossover above the 9-day and 21-day moving averages. The bulls are dominating the market, hovering above the 9-day and 21-day moving averages.
Neo Price Prediction: Neo (NEO) May Trigger Fresh Rally
Looking at the daily chart, the Neo price can only increase the bullish movement if the $11.5 support is maintained at all costs. Currently, the technical indicator Relative Strength Index (14) is likely to cross above 60-level by sending bullish signals into the market which can encourage more buyers to enter the market.
Meanwhile, the red line of the 9-day moving average may need to cross above the green line of the 21-day moving average, so that the Neo (NEO) may continue to do well and the market price may reach the resistance levels at $16.0, $17.0, and $18.0 respectively. On the contrary, if the coin decides to make a slide below the moving averages, then, there may be a quick bearish drop which may likely bring the market down to the support levels of $9.5, $8.5, and $7.5 respectively.
When compares with Bitcoin, the Neo price is aiming to cross above the 9-day and 21-day moving averages as the coin faces the upside. Meanwhile, the technical indicator Relative Strength Index (14) is seen moving towards the 50-level. However, for the fact that the market price keeps moving sideways, the coin is likely to move bullishly as the bulls step into the market.
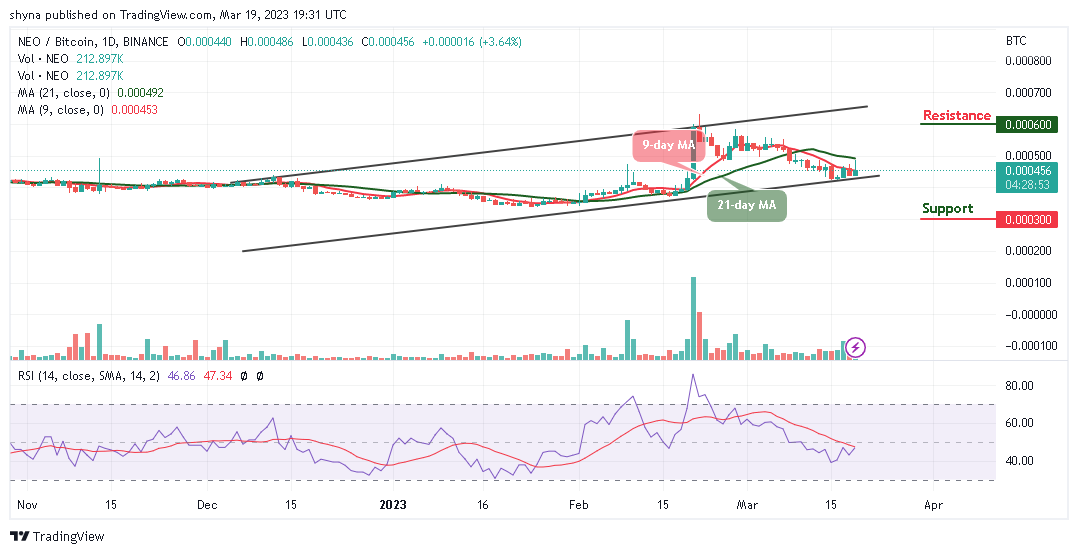
Meanwhile, the daily chart reveals that the potential resistance level could be located at 600 SAT and above, but a bearish movement may likely cancel the bullish pattern, which could attract new sellers coming into the market with the next focus on the support level of 300 SAT and below.
Alternatives to NEO
According to the daily chart, the bulls are now coming back into the Neo market. Therefore, if the buyers can put more effort and push the market price above the upper boundary of the channel, NEO/USD may likely create an additional gain. Meanwhile, Love Hate Inu (LHINU) is a fast-rising meme coin project set to revolutionalize the $3 billion online survey industry with its utility vote-to-earn (V2E) Web3 technology. At the time of writing, the LHINU token has raised almost $2 million in investment since its official presale launch, showing huge excitement from investors.
Join Our Telegram channel to stay up to date on breaking news coverage