Join Our Telegram channel to stay up to date on breaking news coverage
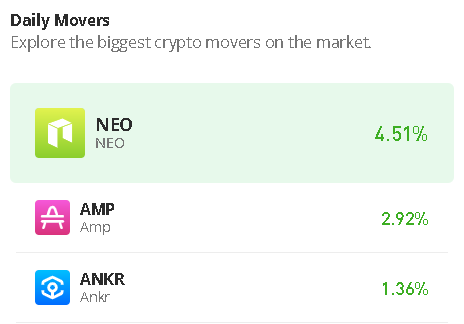
The Neo price prediction reveals that NEO is facing key resistance at $14 as the market price may gain more upsides.
Neo Prediction Statistics Data:
- Neo price now – $13.3
- Neo market cap – $944.2 million
- Neo circulating supply – 70.5 million
- Neo total supply – 100 million
- Neo Coinmarketcap ranking – #55
NEO/USD Market
Key Levels:
Resistance levels: $17.0, $18.0, $19.0
Support levels: $10.0, $9.0, $8.0
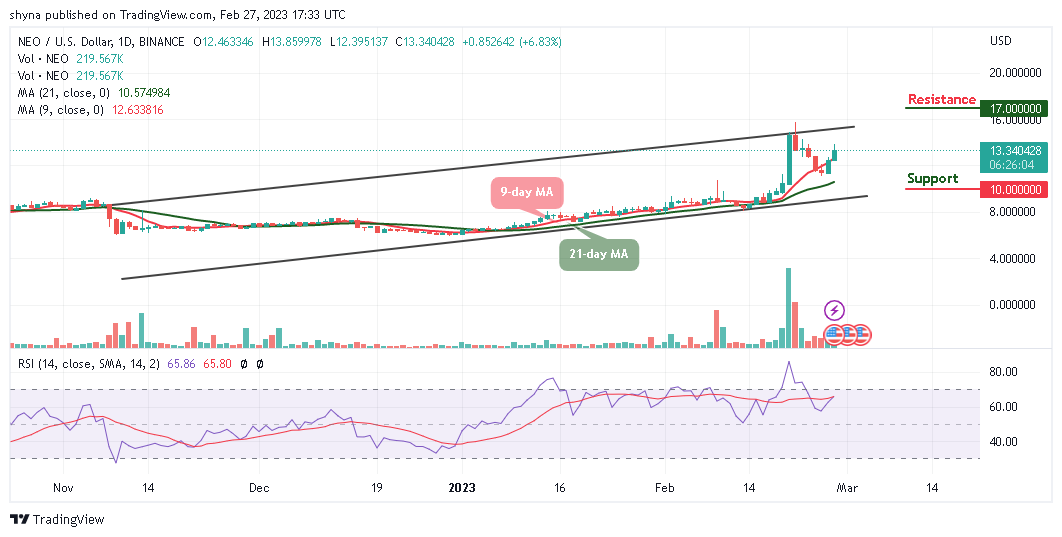
After touching the resistance level of $13.8, NEO/USD begins to drop with a bearish bias. The coin opens at $12.4, and it is currently trading above the 9-day and 21-day moving averages. For the past few days, the Neo price has been following the bullish movement, aiming to cross above the upper boundary of the channel.
Neo Price Prediction: NEO May Spike to the North
At the time of writing, the Neo price is trading bullishly, and it is likely to break above the upper boundary of the channel. However, NEO/USD is currently hovering at $13.3 as it prepares for the upside. Meanwhile, should it slide below the 9-day and 21-day moving averages, the critical support levels of $10.0, $9.0, and $8.0 may be tested but the technical indicator Relative Strength Index (14) crosses above the upper boundary of the channel.
Meanwhile, NEO/USD could recover towards the channel or extend its decline toward the support level of $12.0. On the upside, the next major resistance is near the $16.0 level, but, the coin may hit the resistance levels of $17.0, $18.0, and $19.0. If not, there is a risk of more downsides toward the lower boundary of the channel.
Against Bitcoin, the daily chart shows that the Neo price is hovering above the 9-day and 21-day moving averages. If the price crosses above the upper boundary of the channel, there is a possibility that the coin may create additional gains. The next resistance key above this barrier is close to the 650 SAT. If the price rises, it could even break the 700 SAT and above in future sessions.
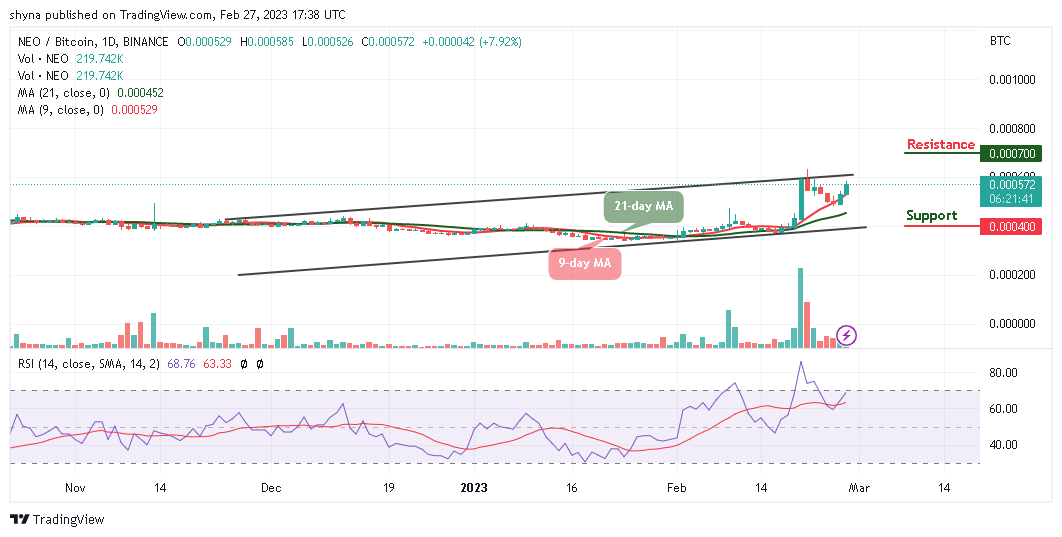
However, if the bears bring the price below the 9-day and 21-day moving averages, 450 SAT support may play out. Any further bearish movement could roll the coin to critical support at 400 SAT and below. The Relative Strength Index (14) is moving to cross into the overbought region, suggesting bullish signals.
NEO Alternatives
The Neo price may continue to move upside if the current support level at $12.3 holds, the market value of the coin may likely retest the $13.8 resistance level soon. The coin is having a bullish posture in its long-term view and there is a potential upside as it is heading toward a rate hike. Meanwhile, the Fight Out (FGHT) token presale is ongoing as close to $5 million has been raised so far. However, traders who are interested in the coin should invest before the end of the presale session.
Join Our Telegram channel to stay up to date on breaking news coverage