Join Our Telegram channel to stay up to date on breaking news coverage
The Neo price prediction shows that NEO is changing hands at $10.46 as the technical indicator faces the north.
Neo Market Price Statistic:
- Neo price now: $10.46
- Neo market cap: $743.7 million
- Neo circulating supply: $70.5 million
- Neo total supply: $100 million
- Neo coin market ranking: #68
NEO/USD Market
Key Levels:
Resistance levels: $12.0, $13.0, $14.0
Support levels: $8.0, $7.0, $6.0
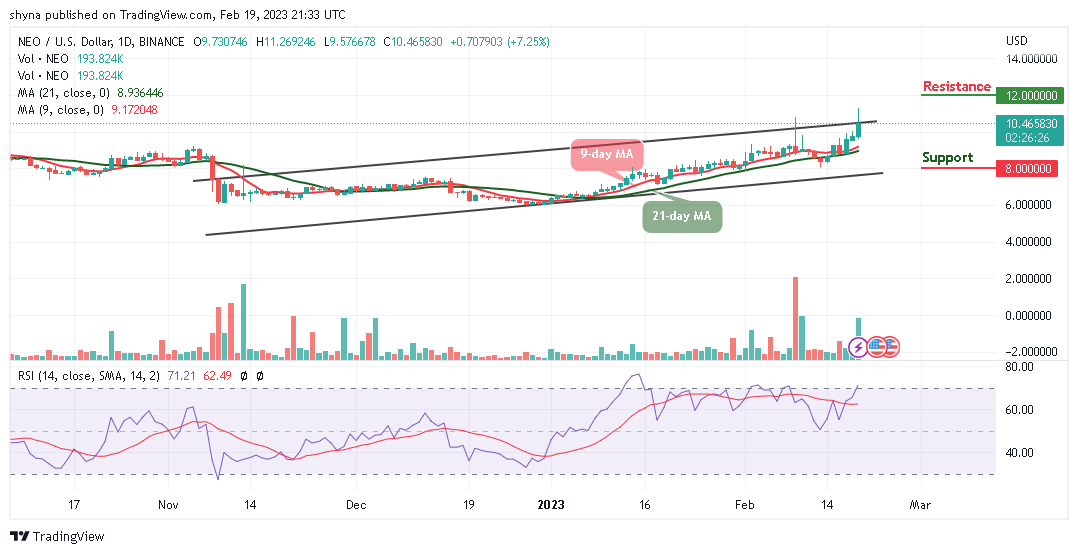
NEO/USD is currently trading around $10.46 and once it manages to surpass the potential resistance of $11.30, the next target could be located at $11.50 where it trades above the 9-day and 21-day moving averages. However, a push from here could send the price above the upper boundary of the channel as the daily low is spotted at the $9.50 support level. If the current level fails to hold strong, the Neo (NEO) could slip below the 9-day and 21-day moving averages.
Neo Price Prediction: Is Neo Ready for the Upside?
Looking at the daily chart, the Neo bulls are now coming back into the market. Therefore, if the buyers can put more effort and push the market price above the upper boundary of the channel, NEO/USD may likely hit the resistance levels of $12.0, $13.0, and $14.0 respectively. In addition, any bullish movement above these key resistance levels may likely encourage further buying.
Moreover, a bearish movement toward the lower boundary of the channel could bring the coin toward the critical supports at $8.0, $7.0, and $6.0. Meanwhile, looking at the technical indicator Relative Strength Index (14), Neo may exhibit the tendencies to follow an upward trend as the signal line moves into the overbought region, suggesting that the market may head to the upside.
When compares with Bitcoin, the Neo price is hovering above the 9-day and 21-day moving averages which could hit the nearest resistance at 450 SAT. Therefore, unless this resistance effectively holds and the price ends up closing above it, there might not be any reason to expect a long-term bullish reversal.
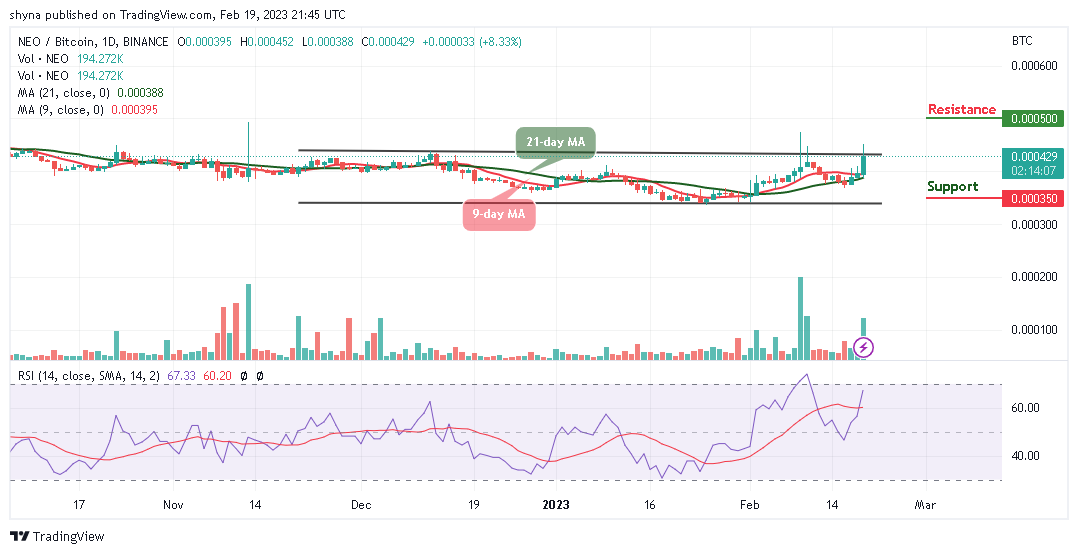
However, bringing the price towards the lower boundary of the channel could refresh lows under 380 SAT as a possible bearish continuation may likely hit the major support at 350 SAT and below. Moreover, the buyers may push the coin to the potential resistance at 500 SAT and above as the technical indicator Relative Strength Index (14) is ready to cross above the 70-level, suggesting more bullish signals.
NEO Alternatives
The Neo price is seen refreshing to a new high as the coin breaches above the $11.0 resistance level with a bullish crossover above the channel. The coin can only bring additional gains if the bulls increase the buying pressure. Meanwhile, there is a Fight Out (FGHT) token presale that is ongoing at the moment, and close to $4.5 million has been raised during the presale, investors are expected to invest in the new coin before the expiration of the presale.
Join Our Telegram channel to stay up to date on breaking news coverage