Join Our Telegram channel to stay up to date on breaking news coverage
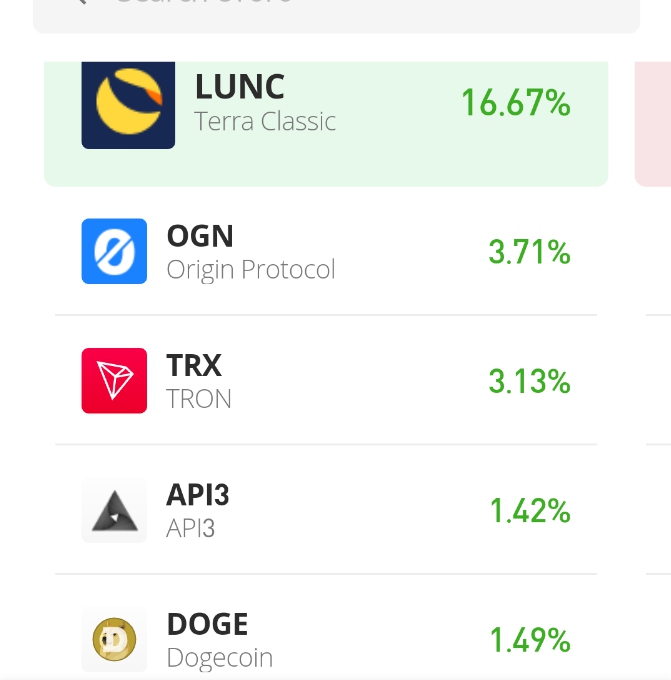
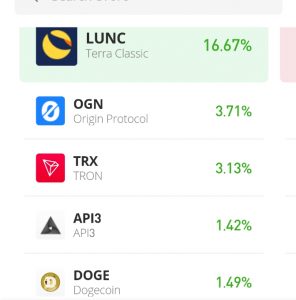
LUNC/USDT threw down APE/USD from the top of the crypto daily mover list to occupy the number spot today. Terra Classic moved an impressive 16.67% today. This is an impressive performance for the recently embattled crypto.
LUNC/USDT present price Price: $0.00007358
LUNC/USDT Market Capitalization: 494 Million
LUNC/USDT Total Supply: 6.9 Trillion
LUNC/USDT Rank: 214
Key Levels:
Resistance: $0.00007325, $0.00007338, $0.00007358
Support: $0.00007320, $0.00007310, $0.00007300
LUNC Value Prediction: LUNC/USDT Impressive Display
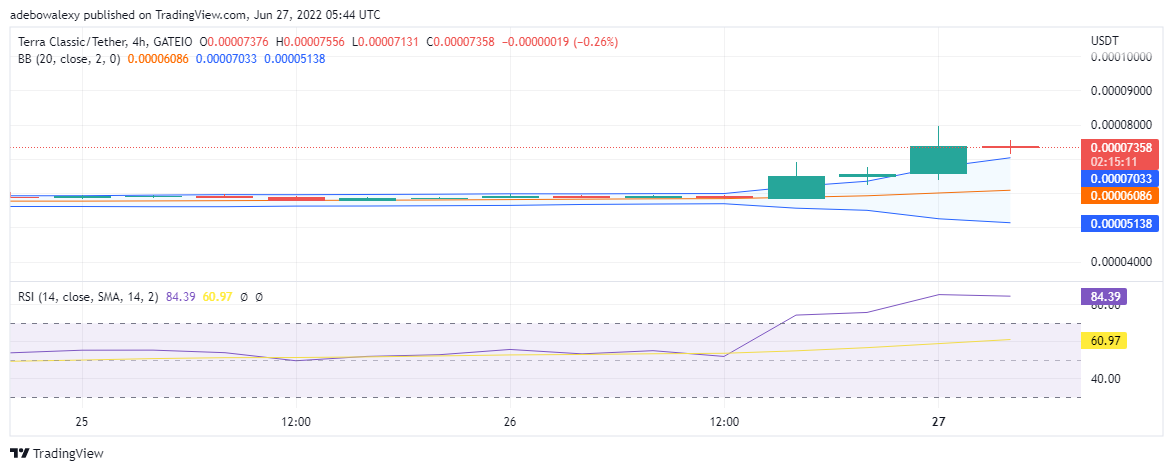
Looking at the LUNC/USDT four hours chart, we can see that this market is putting on an impressive show. The crypto Jumped from $0.00006086 to $0.00007358. On this chart, this crypto seems to be very bullish at the present. we can also see that the value activity of this crypto has touched the upper band of the Bollinger band indicator. Also with the activity of the bulls in this market, it appears as if the volatility is gradually increasing. Consequently, the increasing volatility may cause the crypto to break new price levels such as the $0.00007500 and $0.00008000.
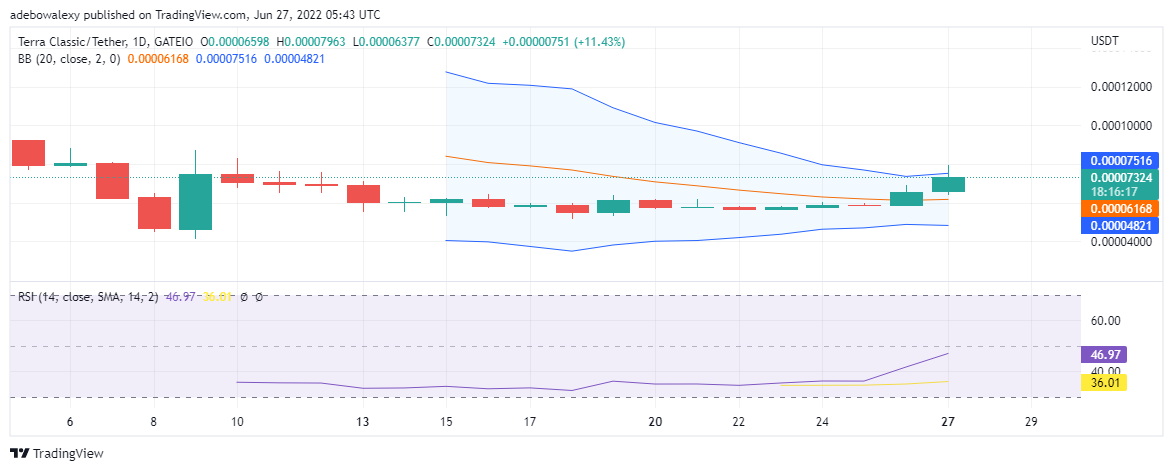
LUNC Value Prediction: LUNC/USDT Value is stepping Up
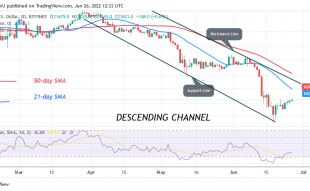
On the daily chart, the activity of the last bullish candlestick seems to be increasing LUNC/USDT volatility. In addition, this can be confirmed on the Bollinger band, as the upper boundary seems to make a sharp bend.
Also, we can observe that the RSI indicator lines are bought above the highly sold area of 30%. However, the faster RSI line is rising towards the 50% mark. The activity on this indicator may be indicating that a bullish trend has already begun.
In addition to the Bollinger activity, the RSI is confirming that the market volatility is gradually building up.
Join Our Telegram channel to stay up to date on breaking news coverage