Join Our Telegram channel to stay up to date on breaking news coverage
LTC Price Prediction – March 25
At market opening today, LTC/USD price keeps following a bearish movement within the channel.
LTC/USD Market
Key Levels:
Resistance levels: $200, $210, $220
Support levels: $150, $145, $140
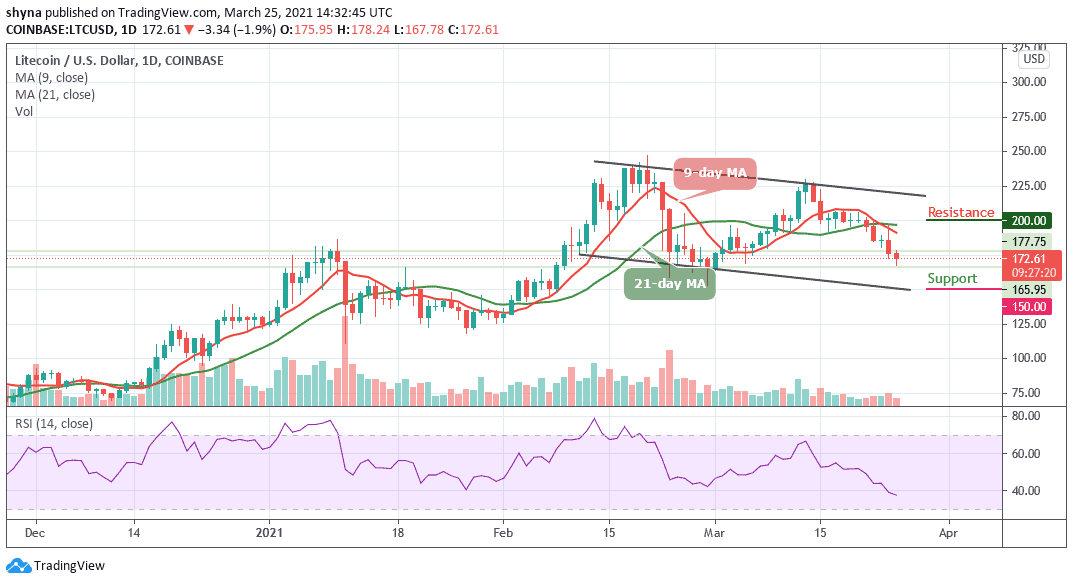
LTC/USD drops by over 1.0% over the past 24 hours of trading as the coin stays below the 9-day and 21-day moving averages to reach the daily low of $167.78 level. However, it seems that the bullish momentum is fading quickly as the technical indicator RSI (14) plummets below the 40-level. A break beneath 35-level may cause the coin to follow the downtrend as the bears may take control of the market momentum.
Where is LTC Price Going Next?
As the coin moves within the channel, in as much as the Litecoin price fails to rally from current trading levels, the greater the chance traders may see the cryptocurrency falling to another trading low. Meanwhile, a break below the lower boundary of the channel may provoke an even deeper decline towards the $150, $145, and $140 levels.
Looking at the daily chart, a break above the moving averages may propel LTC/USD to move towards the potential resistance levels of $200, $210, and $220. Meanwhile, the RSI (14) is currently facing the south as the signal line moves below 40-level which could cause the market to experience more downward trends.
Comparing with BTC, the price of Litecoin is following a bearish movement below the 9-day and 21-day moving averages. The cryptocurrency on the market cap is finding its way toward the lower boundary of the channel because the market movement has remained clouded by more red candles.
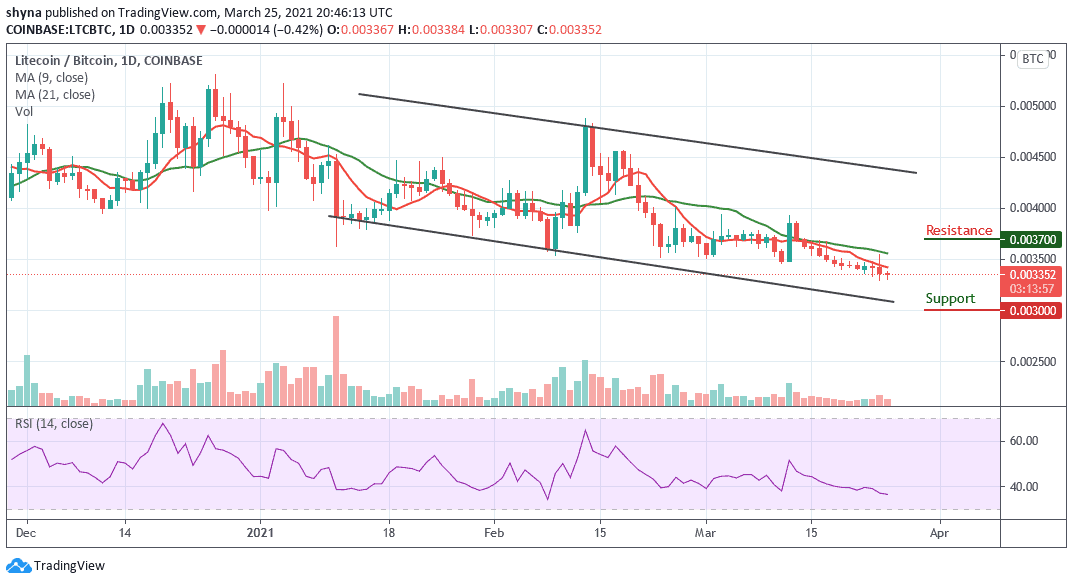
However, as the RSI (14) nosedives to 40-level, a bearish continuation may likely roll the market to the support of 3200 SAT with a possible break below the channel. A further decline could be at 3000 SAT and below, which may establish a new low for the market. Meanwhile, any bullish movement above the moving averages may hit the resistance levels of 3700 SAT and above.
Join Our Telegram channel to stay up to date on breaking news coverage