Join Our Telegram channel to stay up to date on breaking news coverage
Bitcoin (BTC) Price Prediction – March 25
The Bitcoin bulls prepare for a shock as the technical indicator getting ready to send the first digital asset to $45,000.
BTC/USD Long-term Trend: Bullish (Daily Chart)
Key levels:
Resistance Levels: $57,000, $59,000, $61,000
Support Levels: $45,000, $43,000, $41,000
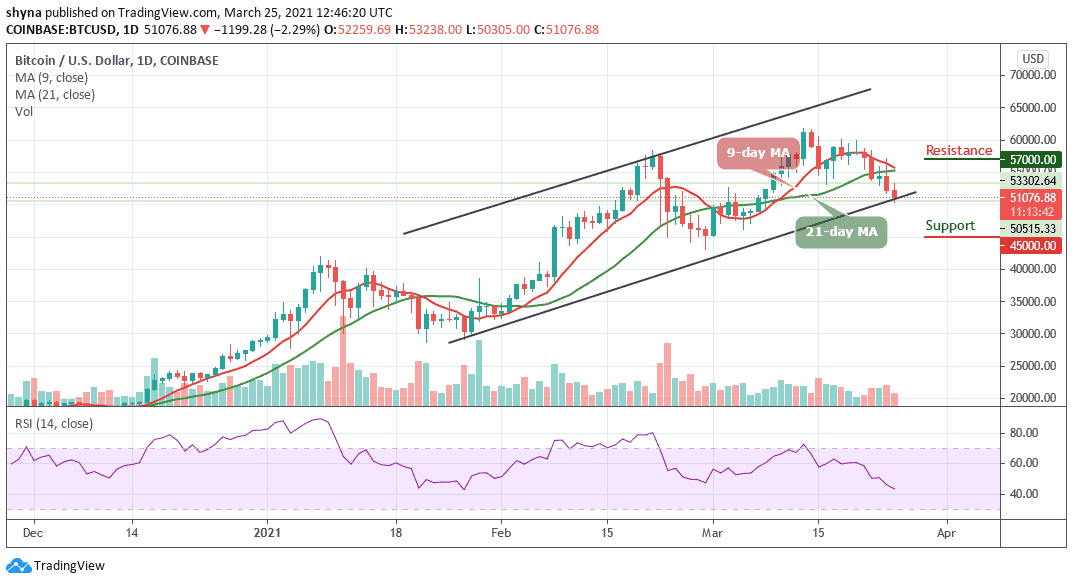
BTC/USD is seen falling towards $50,000 once again as the largest cryptocurrency embarked on a support smashing exercise after failing to hold above $53,000 following a significant breakout in the last few days. The bearish control is widespread across the market with other major digital assets posting similar losses as they trade below the 9-day and 21-day moving averages.
What is the Next Direction for Bitcoin?
At the time of writing, BTC/USD is recovering above $51,000 from the daily low of $50,305. However, if bulls increase their entries, they might likely create more volume, in turn, pushing the market price above the next key levels at $54,000 and $56,000. It is now clear that $57,000 is the most critical level in Bitcoin’s recovery journey. Therefore, the further bullish movement may reach other resistance levels at $59,000 and $61,000.
According to the technical indicator RSI (14), BTC/USD is still in an area with intense support as the signal line crosses below 45-level. This explains the immediate reversal above $51,050. On the other hand, a breakdown under the pattern’s support is likely to encourage more selling entries which may likely pull the BTC/USD massively below $50,000. However, losses below the moving averages could signal more retracement to levels closer to $45,000, $43,000, and $41,000 supports.
BTC/USD Medium-Term Trend: Bearish (4H Chart)
On the 4-Hour chart, the Bitcoin price stays below the 9-day and 21-day moving averages and the immediate support is below the moving averages at the $51,000 level. The price may likely fall below $50,000 if the bears fully stepped back into the market.
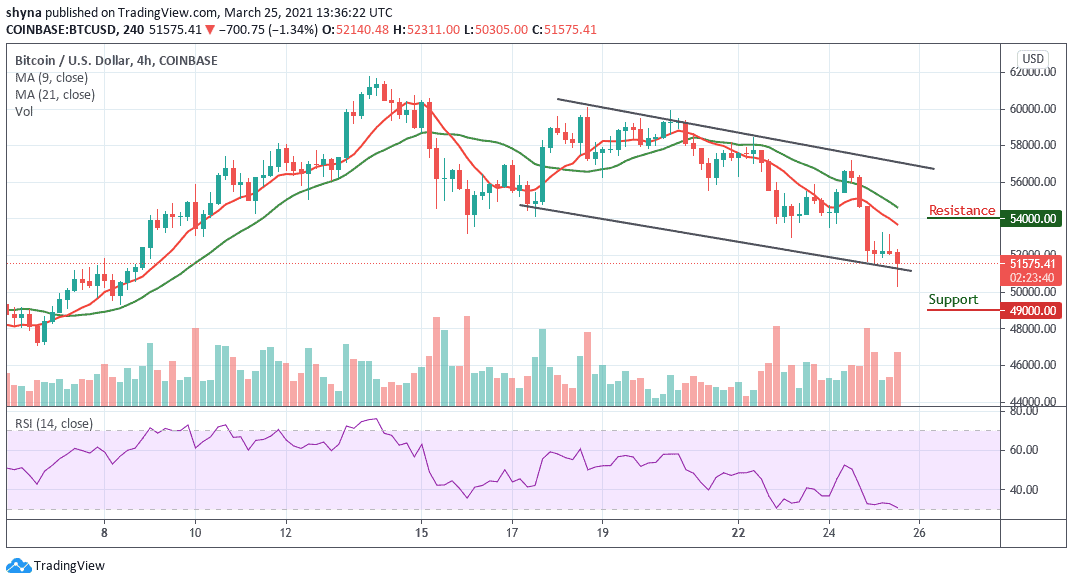
However, a further bearish movement could test the critical support at the $49,000 level and below while the resistance is located above the moving averages at the $54,000 and above. Technically, Bitcoin is currently moving into the negative side as the technical indicator RSI (14) moves into the oversold region.
Join Our Telegram channel to stay up to date on breaking news coverage