Join Our Telegram channel to stay up to date on breaking news coverage
LTC Price Prediction – March 20
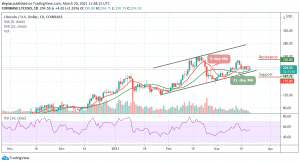
LTC/USD manages to maintain its position, while the bulls maintain the desire to defend the support at $200.
LTC/USD Market
Key Levels:
Resistance levels: $230, $240, $250
Support levels: $175, $165, $155

After being locked within the 9-day and 21-day moving averages, LTC/USD is undergoing a much-needed break to the positive side. The coin is posting gains of over 2.3% in the last 24 hours, with the coin trading above the 21-day moving average and at a price of $204.56 at the time of writing.
Where is LTC Price Going Next?
LTC/USD resumes back in the middle of consolidation after a slight drop from near the $205 yesterday. The price is now roaming around the $204 level. Meanwhile, if the market continues the upward movement, the $220 resistance level is likely to surface in the next few positive moves. More so, LTC/USD pair might further look for higher price levels if the bulls continue to show commitment.
However, the market is currently displaying a sign of subduing volatility with choppy price action. Taking a look at the daily chart, we can see the trading volume is rising slowly. On the other hand, if LTC/USD pair decides to stay under the control of bears, the price may likely roll back to the previous supports at $175, $165, and $155. But as the RSI (14) indicator moves above 50-level, the next resistance levels could be located at $230, $240, and $250 respectively.
Against Bitcoin, LTC continues to experience some difficulties, as the coin recently exploded under the 9-day and 21-day moving averages, as it continues to fall towards the nearest support level of 3500 SAT. Meanwhile, the critical support level is located below the lower boundary of the channel at 3000 SAT and below.

However, any attempt by the bulls to re-power the market, the coin may likely cross the moving averages and may find the resistance level at 3800 SAT and above. Meanwhile, the price of Litecoin is currently changing hands to 3455 SAT and a spike in volatility could occur as the RSI (14) is seen moving around 40-level.
Join Our Telegram channel to stay up to date on breaking news coverage