Join Our Telegram channel to stay up to date on breaking news coverage
Bitcoin (BTC) Price Prediction – March 20
The past few days were quite volatile for BTC/USD as the price went from breaching above $60,000 to a sudden drop to $53,000 before reclaiming over $5,000 again now.
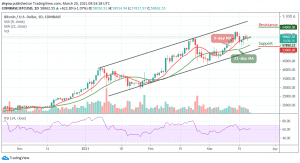
BTC/USD Long-term Trend: Bullish (Daily Chart)
Key levels:
Resistance Levels: $64,000, $66,000, $68,000
Support Levels: $53,000, $51,000, $49,000

BTC/USD bulls may slowly come back into action after a minor battering from the bears. If this happens, then the expectation of recovery could turn out to be true. More so, BTC/USD was seen trading at $56,260 after soaring to $59,461 yesterday. The coin is trading currently above the 9-day and 21-day moving averages, it may continue to head upwards if bulls fully step back into the market.
What is the Next Direction for Bitcoin?
BTC/USD is trading above the resistance level of $58,000 and the bears have not been able to break the support level because BTC rebounds at the crucial support level. On the other hand, the bulls have not been able to break the $61,000 resistance after four attempts. On the upside, if buyers continue to push the BTC above the moving averages, the price momentum could be accelerated to break the $64,000, $66,000, and $68,000 resistance levels.
Moreover, BTC/USD touches the daily high of $58,914 level as the price resumes upward. The upside momentum of Bitcoin has been possible because of the support levels of $53,000, $51,000, and $49,000. Each time the Bitcoin price falls, the coin will find support above these levels. For instance, during the last breakdown on March 16 and 17, BTC found support above $53,200. The RSI (14) remains at the positive side as the signal line remains above 60-level.
BTC/USD Medium – Term Trend: Bullish (4H Chart)
The 4-hour chart for BTC is still looking bullish; Bitcoin is recovering from the earlier downward move. Buyers have two hurdles to jump over: the hurdles at $59,000 and $60,000. From the daily chart, BTC/USD has a target price of $65,000, if the bulls clear the $59,000 to $61,000 resistance zone and the $63,000 high.
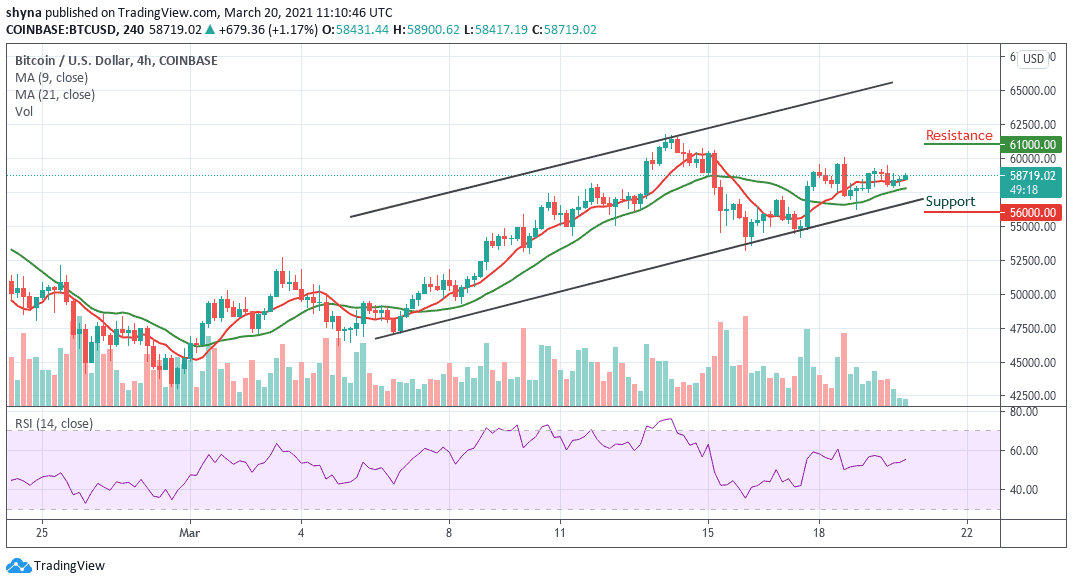
However, considering the recent rebound, the Bitcoin price may continue the bullish rally and a climb above the moving averages may further push BTC price to higher levels. For now, the RSI (14) is looking bullishly as the signal line moves around 55-level.
Join Our Telegram channel to stay up to date on breaking news coverage