Join Our Telegram channel to stay up to date on breaking news coverage
LTC Price Prediction – March 15
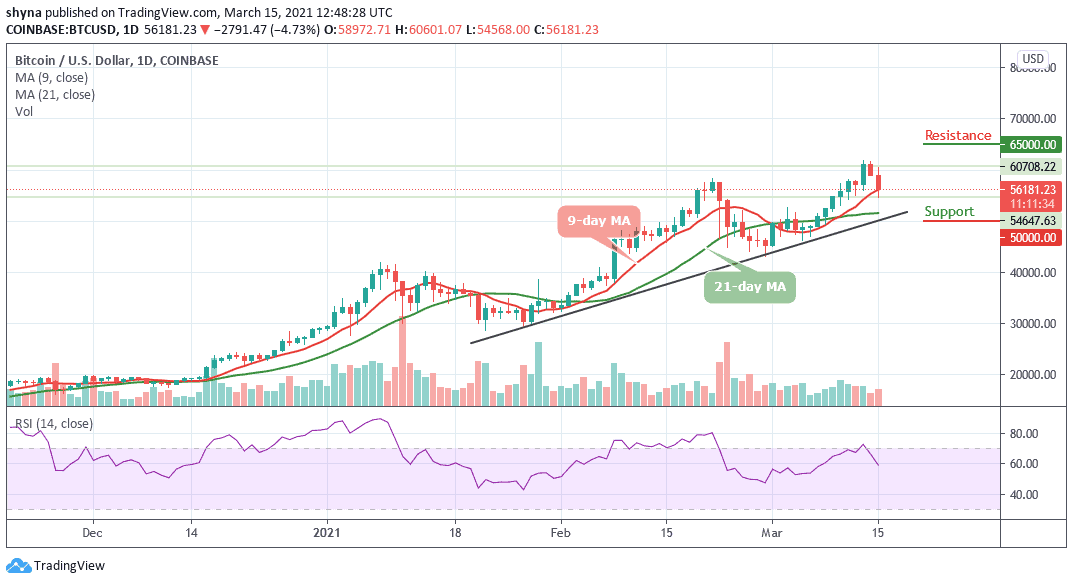
LTC/USD is moving down synchronously within the market and its sell-offs may be extended below the moving averages.
LTC/USD Market
Key Levels:
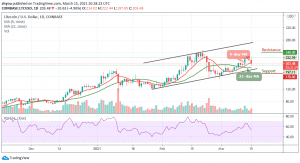
Resistance levels: $240, $250, $260
Support levels: $170, $160, $150
At the time of writing, LTC/USD is changing hands to $203.48, down from the recent high of $222.44. The coin is moving synchronously around the 9-day moving average on the market. The price of Litecoin is mainly influenced by speculative sentiment and technical factors, while fundamental developments remain in the shadows. The cryptocurrency market is known for its herd behavior because everything grows and falls simultaneously.
What to Expect from Litecoin (LTC)
LTC/USD moves above the $220 level as bulls couldn’t hold the ground. The wide-spread retracement on the market pushes the coin below the 9-day moving average with the next local support created by $200. This level is likely to limit the correction and serve as a jumping-off ground for another bullish wave.
However, the sell-off is likely to gain traction with the next focus on $170, $160, and $150 support levels. Meanwhile, on the upside, the initial resistance is created above the moving averages at $220. Traders may need to see a sustainable move above this level to test $230. The further bullish movement could touch the $240, $250, and $260 resistance levels despite the fact that the daily RSI (14) moves below the 55-leveL, suggesting more bearish signals.
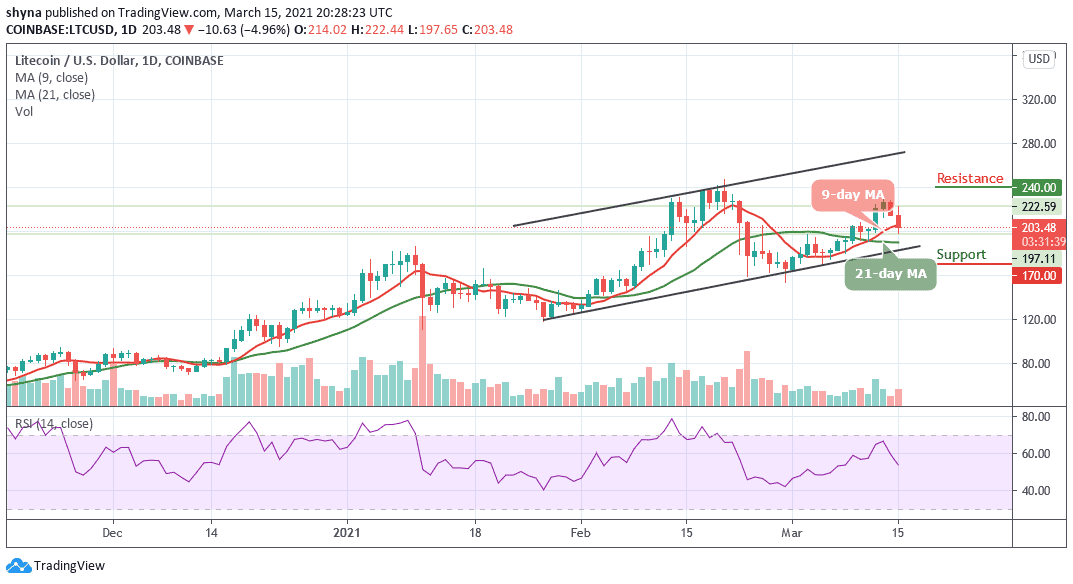
Against Bitcoin, the Litecoin price is experiencing a tremendous downtrend, as the coin remains below the 9-day and 21-day moving averages. The bulls are making an attempt to push the market above the moving averages but the technical indicator RSI (14) keeps heading to the south. However, the critical support level is located around the 3100 SAT and below.
Moreover, if bulls begin to power the market, the coin may likely break above the moving averages to find the potential resistance level at 4100 SAT and above. Meanwhile, the price of Litecoin is currently changing hands to 3600 SAT and a spike in volatility could occur according to the RSI (14).
Join Our Telegram channel to stay up to date on breaking news coverage