Join Our Telegram channel to stay up to date on breaking news coverage
LTC Price Prediction – March 9
The Litecoin price may likely settle above the 9-day and 21-day moving averages as the RSI (14) moves toward 60-level.
LTC/USD Market
Key Levels:
Resistance levels: $230, $240, $250
Support levels: $150, $130, $110
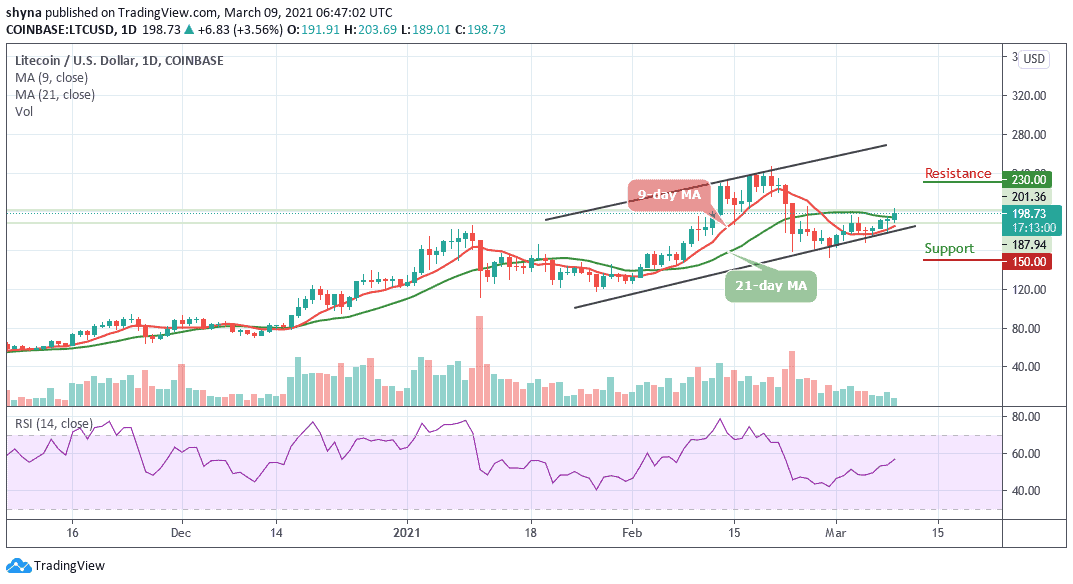
LTC/USD is currently trading above the 9-day and 21-day moving averages within the channel. However, the cryptocurrency has been following an uptrend since the beginning of this month, and should the buyers keep it above the moving averages, the coin might remain at the upside. Today, an early trading session touches the $203 level before rebounding to where it is trading currently at $198.73.
What is the Next Direction for Litecoin?
However, if the resistance of $200 gives way, the bull-run may come to focus and it may be extended above the moving averages. At the moment, the bullish scenario seems more dominant as buyers continue to post firm commitments into the market. For the past few days, we could see a sharp rise in the market price. Moreover, if the coin stays above the $200 resistance level and this could further strengthen the market to $230, $240, and $250 resistance levels.
On the downside, a lower possible swing may likely retest the previous support below the moving averages. However, if the bears manage to fuel the market, traders may expect a further drop to $150, $140, and $130 support levels. In other words, RSI (14) is now moving towards 60-level, indicating that the market may retain the bullish trend.
Comparing LTC with BTC, we can easily see that the pair is breaking below the 9-day and 21-day moving averages from the daily high of 3747 SAT. Litecoin price could see another sharp drop if it crosses below the channel. Breaking this barrier could further take the price to the critical support levels at 3200 SAT and 3000 SAT.
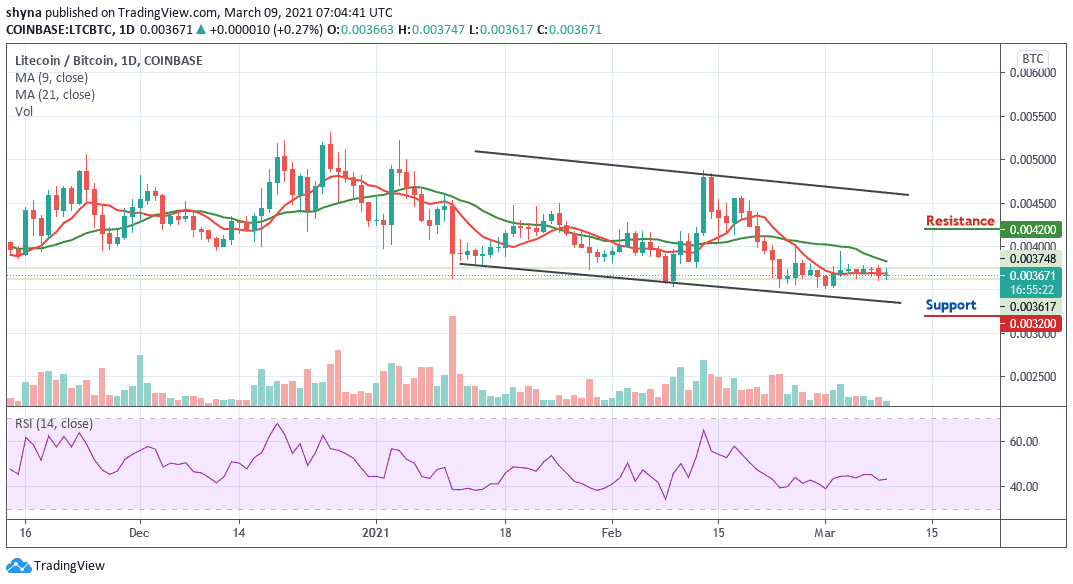
Presently, the Litecoin price is trading at 3671 SAT, if the bulls can hold the price as it is and move the market upward, the next key resistance levels lie at 4000 SAT respectively. Reaching this level might take it to the potential resistance levels of 4200 SAT and 4400 SAT. Meanwhile, the RSI (14) is seen moving in the same direction, indicating a sideways movement.
Join Our Telegram channel to stay up to date on breaking news coverage