Join Our Telegram channel to stay up to date on breaking news coverage
LTC Price Prediction – January 7
The Litecoin price is currently changing hands at $170.30 as the technical indicator moves within the overbought zone.
LTC/USD Market
Key Levels:
Resistance levels: $200, $210, $220
Support levels: $135, $125, $115
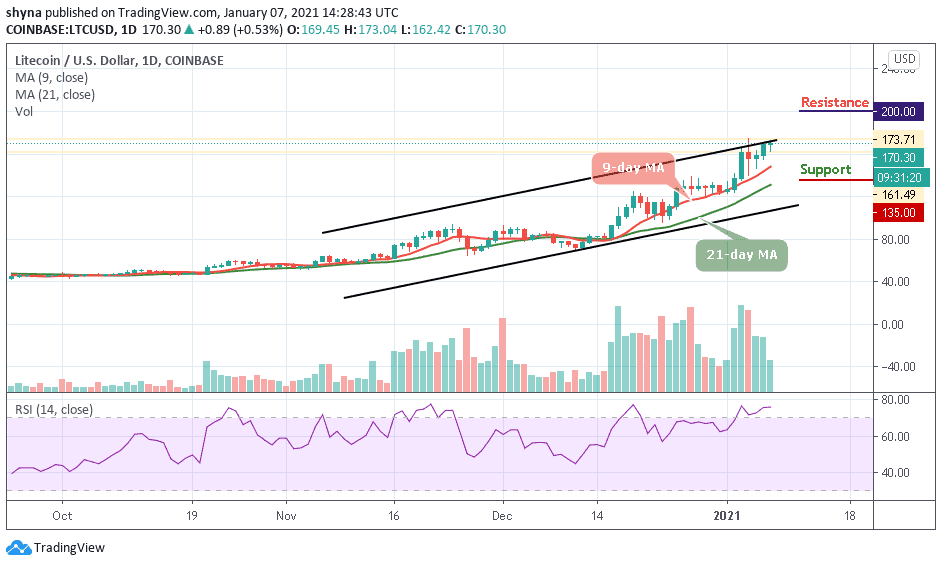
LTC/USD is currently trading at around $170. Once it manages to surpass the daily high of $173, the next target is at $180 where it could touch in the next few days. However, a breach from the current market value may send the price straight to around the $150 support level. More so, if this level fails to hold strong, the price could slip back below the 9-day and 21-day moving averages.
What to Expect from Litecoin (LTC)
The Litecoin (LTC) is yet to clear the hurdles towards the resistance level of $175. Instead, the bears are trying to force their way back to the $160 support level. A break below the $150 support level may provoke an even deeper decline towards the $135, $125, and $115 support levels. Looking at the RSI (14), Litecoin may exhibit the tendencies to follow an upward trend as the signal line is still moving within the overbought region.
In addition, if the bulls gather enough strength and push the market above the upper boundary of the channel, then the price may likely hit the resistance levels of $200, $210, and $220 respectively. So, further movement above these key resistance levels could therefore encourage more buying.
When compares with Bitcoin, the Litecoin price continues to trend bearishly as the support further outweighs the resistance. Therefore, should in case there is a trend reversal, there may be a need for an increasing volume and resistance to cause an upsurge in the market. Now, the coin is trading around the 4402 SAT below the moving averages. We can expect close support at the 4000 SAT and below.
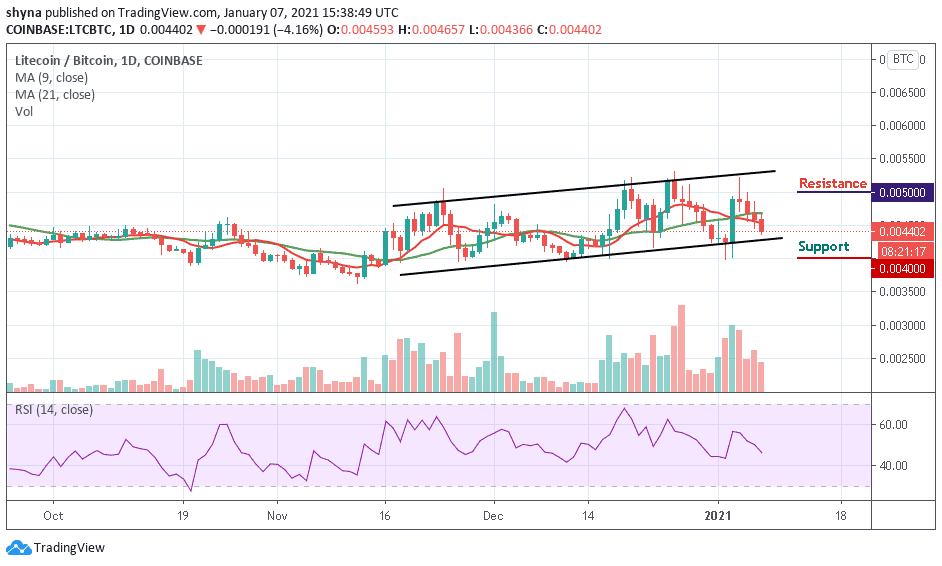
For now, there’s no sign of a bullish movement in the market. However, if a bullish move occurs and validates a break significantly above the 9-day and 21-day moving averages to hit the nearest resistance at 4800 SAT; we can then confirm a bull-run for the LTC/BTC pair. More so, the closest resistance lies at 5000 SAT and above as the RSI (14) moves below 45-level, suggesting more bearish movement.
Join Our Telegram channel to stay up to date on breaking news coverage