Join Our Telegram channel to stay up to date on breaking news coverage
Bitcoin (BTC) Price Prediction – January 7
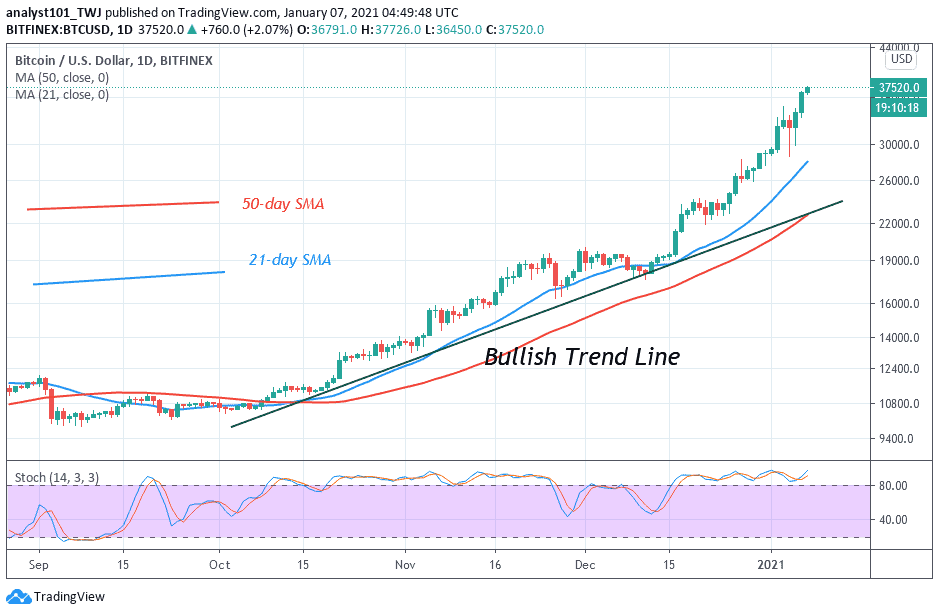
The Bitcoin (BTC) is creating another bullish candlestick today, reaching the highest daily close ever at $37,823 as the technical indicator does not yet show any weakness.
BTC/USD Long-term Trend: Bullish (Daily Chart)
Key levels:
Resistance Levels: $41,300, $41,500, $41,700
Support Levels: $30,800, $30,600, $30,400
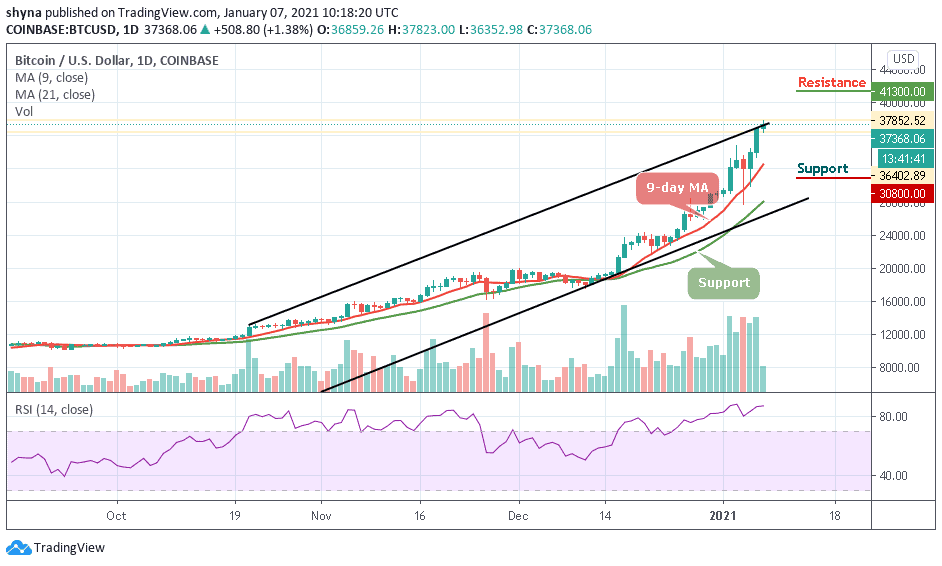
BTC/USD set new all-time high just minutes ago as it has pushed past $37,800 for the first time ever. The cryptocurrency is now up 1.38% in the past 24 hours and is now up nearly 30% in the past seven days alone. Moreover, the Bitcoin price has quickly dipped back under the resistance level of $37,000 as the cryptocurrency has encountered some selling pressure at those key levels.
What is the Next for Bitcoin?
The strength in BTC’s high time frame market structure seems to indicate that a move up towards $40,000 could be imminent in the near-term. At the time of writing, BTC/USD is trading up at its current price of $37,368 which marks a notable rise from recent lows of $36,352 that were set at the beginning of today’s trading. However, the bears did not have enough strength to shatter this price region as it appears that bulls now have the upper hand.
Nevertheless, if the market decides to fall, the price of Bitcoin could fall below the 9-day moving average at $32,000, and if that support fails to hold the sell-off, traders could see a further decline towards the support levels of $30,800, $30,600, and critically $30,400. All the same, any further bullish movement above the upper boundary of the channel may hit the resistance levels at $41,300, $41,400, and $41,100 as the RSI (14) remains within the overbought region.
BTC/USD Medium – Term Trend: Bullish (4H Chart)
Looking at the 4-hour chart, BTC/USD is trading above the resistance level of $38,000 at the time of writing. However, the beginning of today’s trading at $36,511 is now serving as a key support level. Meanwhile, the main key support levels are located at $34,800, $34,600, and $34,400.
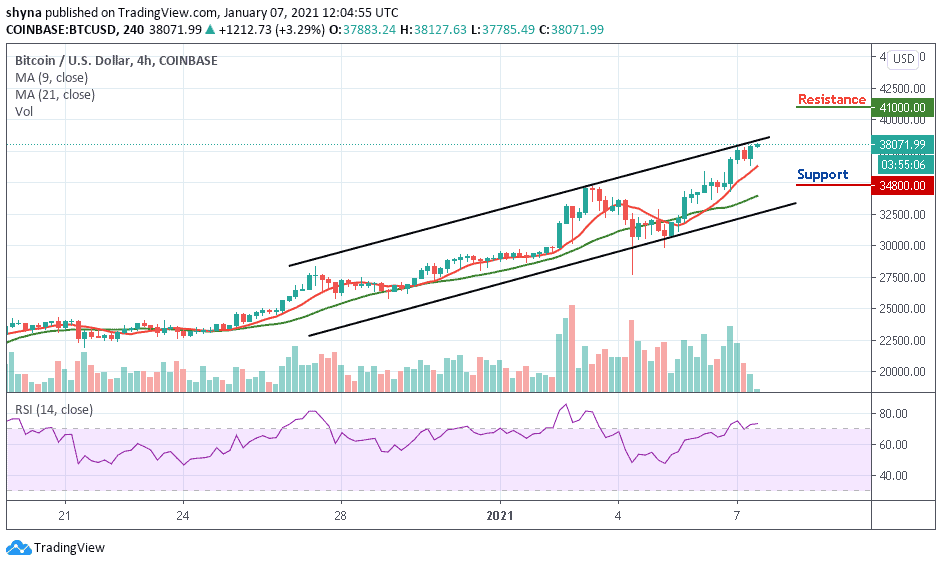
However, in as much as the buyers continue to reinforce and power the market, the next resistance level is located at $40,000, and breaking this level may further push the price towards the resistance level of $41,000 and above. Similarly, the RSI (14) continues to move within the overbought condition to confirm the bullish movement.
Join Our Telegram channel to stay up to date on breaking news coverage