Join Our Telegram channel to stay up to date on breaking news coverage
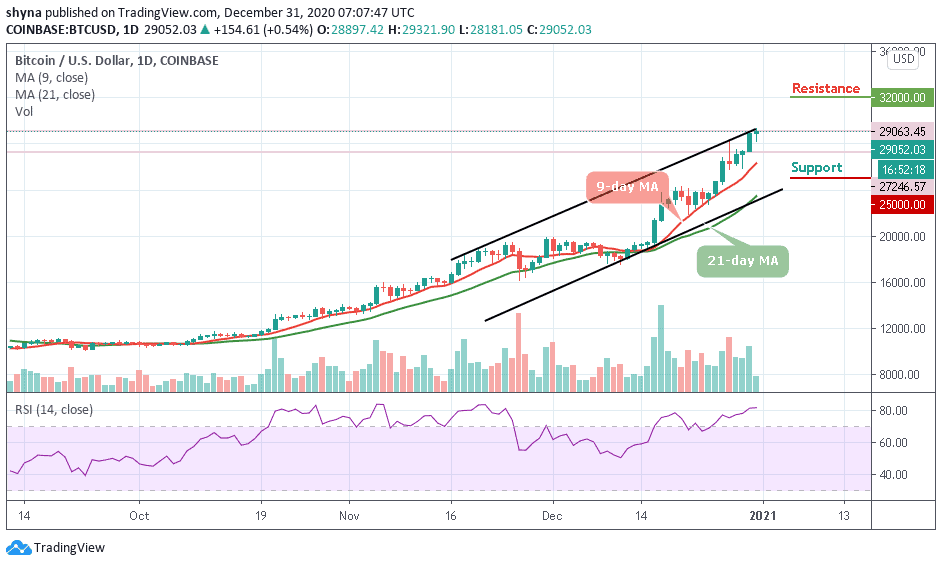
LTC Price Prediction – December 31
LTC/USD may need to stage a meaningful short-term rally or the crypto could see a worrying decline back towards the $120 support level.
LTC/USD Market
Key Levels:
Resistance levels: $150, $155, $160
Support levels: $105, $100, $95

LTC/USD is still trapped in an incredibly narrow trading range after a bullish rally failed to materialize since a few days ago. The cryptocurrency is trading in its tightest six days trading band. Meanwhile, an early day rally towards the $135 level failed to generate sustainable gains, with the LTC/USD pair slipping back under the 9-day moving average.
What is the Next Direction for Litecoin?
LTC/USD pair fails to rally from current trading levels, the greater the chance that traders may see the coin falling to a new trading low. A break below the $120 support level may provoke an even deeper decline towards the $105, $100, and $95 levels. The technical indicator RSI (14) for LTC/USD is moving below the 65-level, suggesting bearish movement for the market.
However, the daily chart highlights that LTC/USD bulls need to re-group and energized the market by breaking above the upper boundary of the channel. However, any further bullish movements could locate the resistance levels of $150, $155, and $160, and a move above this key technical metric should encourage further LTC/USD buying.
Against Bitcoin, the Litecoin price is seen moving below the 9-day and 21-day moving averages. However, the Litecoin (LTC) may continue to follow the downward movement as the bears have been trying to push the coin below the lower boundary of the channel. Therefore, any further bearish movements may likely reach the critical supports at 3800 SAT and below.
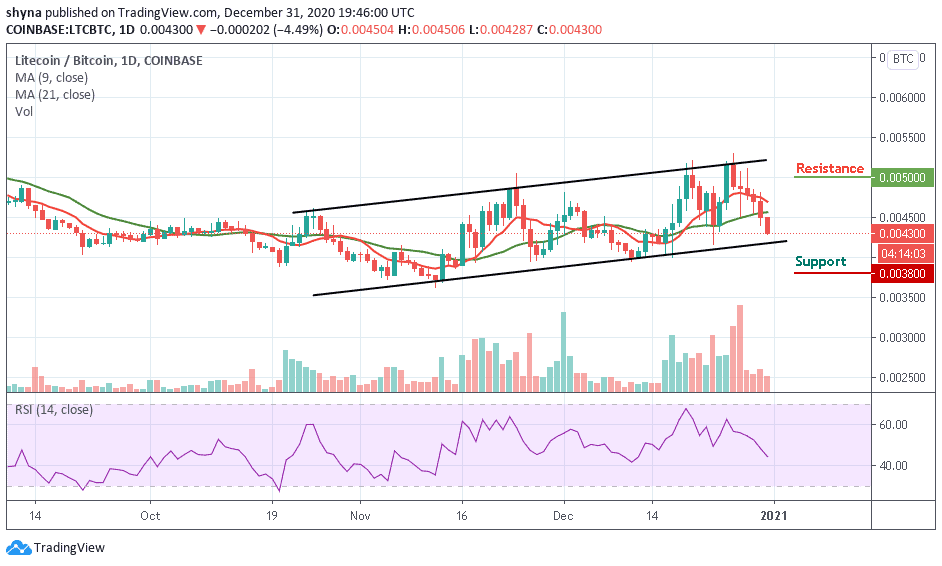
However, as the technical indicator, RSI (14) moves toward the south, suggesting more bearish signals but a bullish step back may likely roll the market back above the 9-day and 21-day moving averages with a possible break out above the channel which could hit the resistance level at 5000 SAT and below, establishing a new monthly high for the market.
Join Our Telegram channel to stay up to date on breaking news coverage