

Join Our Telegram channel to stay up to date on breaking news coverage
Bitcoin (BTC) Price Prediction – December 31
BTC/USD is currently flirting towards the $30,000 resistance level as the king coin hits an intraday high of $29,321.
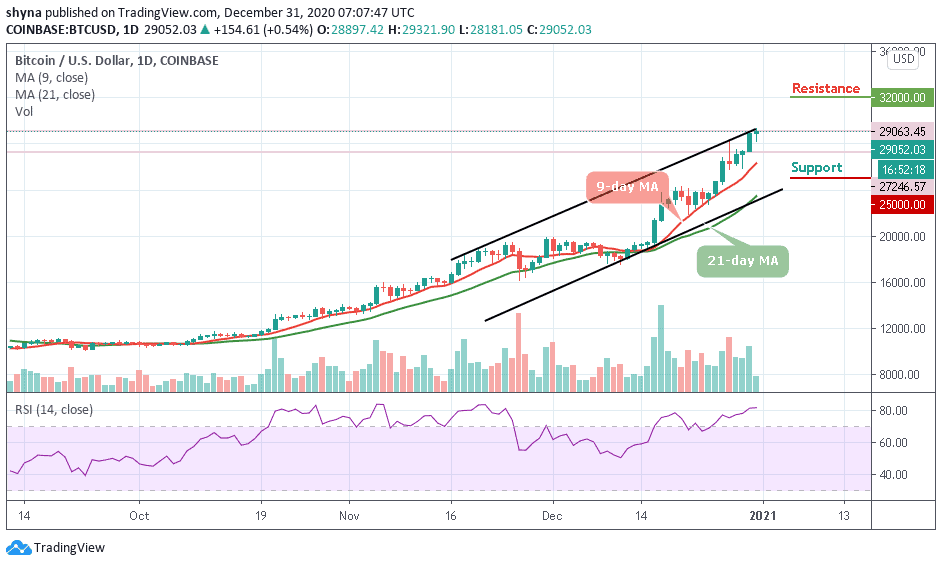
BTC/USD Long-term Trend: Bullish (Daily Chart)
Key levels:
Resistance Levels: $32,000, $32,200, $32,400
Support Levels: $25,000, $24,800, $24,600
BTC/USD is currently holding strong above $29,000 as the coin recovers from the recent drop below $28,000 during the early trading sessions today and now settling above $29,052 at the time of writing. Meanwhile, BTC/USD has been struggling to break the $29,000 resistance since the past few days after a sharp recovery from the recent low of $25,833 a couple of days ago.
Would Bitcoin Continue to Grow Higher?
The Bitcoin bulls are currently trading comfortably above the 9-day and 21-day moving averages as the price establishes a new bullish signal. The last time we saw BTC exchanging hands above $29,000 was yesterday when the coin touched the daily high of $29,018. However, the long-term outlook now favors the bulls, given the daily close produced a large bullish engulfing candle with eyes now set on the daily resistances at $32,000, $32,200, and $32,400 respectively.
However, rejection at $29,300 could eventually lead to declines to the critical support below the 9-day moving average at $25,500. Any further bearish movement may lead to the support levels of $25,000, $24,800, and the psychological $24,600. Alternatively, the technical indicator RSI (14) is remains within the overbought zone, suggesting more bullish signals.
BTC/USD Medium-term Trend: Bullish (4H Chart)
According to the 4-hour chart, the Bitcoin price is seen retreating after touching the daily high at $29,321; however, today’s price move happens to be another impressive one as it climbs above the long-awaited resistance level of $29,000 with a sharp surge. However, BTC/USD is now trading at $28,509 as the RSI (14) moves below 70-level.
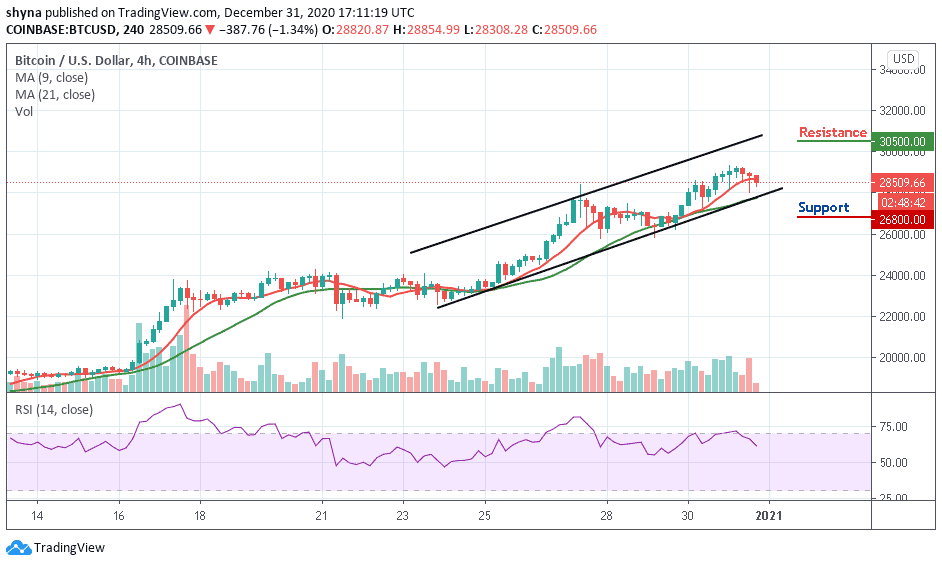
Above the said price mark, BTC may continue a downward movement if the bulls failed to push the price higher again. Therefore, the coin may breach the major support near $28,000 and could reach another support at $26,800 and below. However, if bulls find a decent support around $28,000, the coin may continue its recovery by staying above the 9-day and 21-day moving averages to hit the resistance at $30,500 and above.
Join Our Telegram channel to stay up to date on breaking news coverage
