Join Our Telegram channel to stay up to date on breaking news coverage
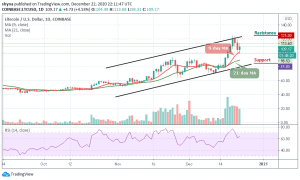
LTC Price Prediction – December 22
LTC/USD may likely set a bullish run if the market can climb back above the $120 resistance level.
LTC/USD Market
Key Levels:
Resistance levels: $125, $130, $135
Support levels: $85, $80, $75

LTC/USD is trading within a positive movement in the past few hours. The market is actually running a little retracement move towards $115 with price growth of 4.53%. However, Litecoin (LTC) is still maintaining an upward movement within the ascending channel. Therefore, traders can expect the price to continue to rise as soon as the bulls put more pressure on the market.
Where is LTC Price Going Next?
If the lower boundary breaks again, the Litecoin price may slide back to $95 and $90 support. Moreover, if the price keeps respecting the upward movement, we can then expect a bullish continuation after testing the $100 support. As the technical indicator RSI (14) faces the north above the 60-level, the next resistance level is located at the $125, $130, and $135 respectively.
However, looking at the price formation, a bearish breakout may likely play out for this market if the coin slides below the 9-day moving average. More so, a bearish extension could roll the coin back to the long-term support at $85, $80, and $75 levels. Therefore, a continuous fall might further lead to a violent break below $70s.
When compares with Bitcoin, buyers are about stepping back into the market while the coin is trying to show some promising signs that could make higher highs should it keep on moving above the 9-day and 21-day moving averages. Looking at from the upside, the nearest resistance level lies at 4800 SAT as higher resistance lies at 5000 SAT and 5200 SAT.
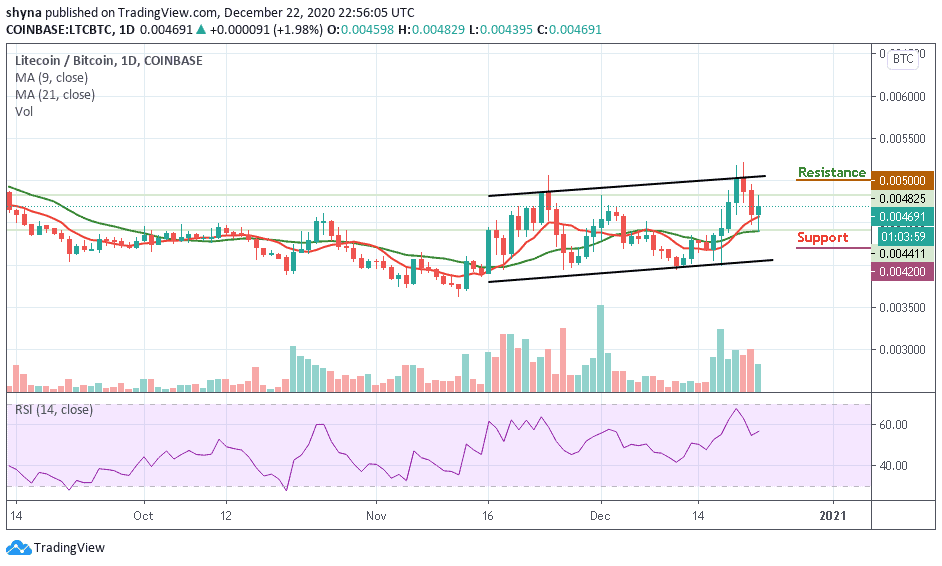
Meanwhile, from the downside; the nearest support level is located at 4400 SAT and if the price drops further to create a new low, lower supports are located at 4200 SAT and 4000 SAT. More so, the RSI (14) facing to cross above the 60-level which shows that the bulls are coming into focus.
Join Our Telegram channel to stay up to date on breaking news coverage