Join Our Telegram channel to stay up to date on breaking news coverage
LTC Price Prediction – November 19
In the opening hours of the day, after retreating to the $71.53, Litecoin price touches the daily high of $83 after several attempts.
LTC/USD Market
Key Levels:
Resistance levels: $90, $92, $94
Support levels: $68, $66, $64
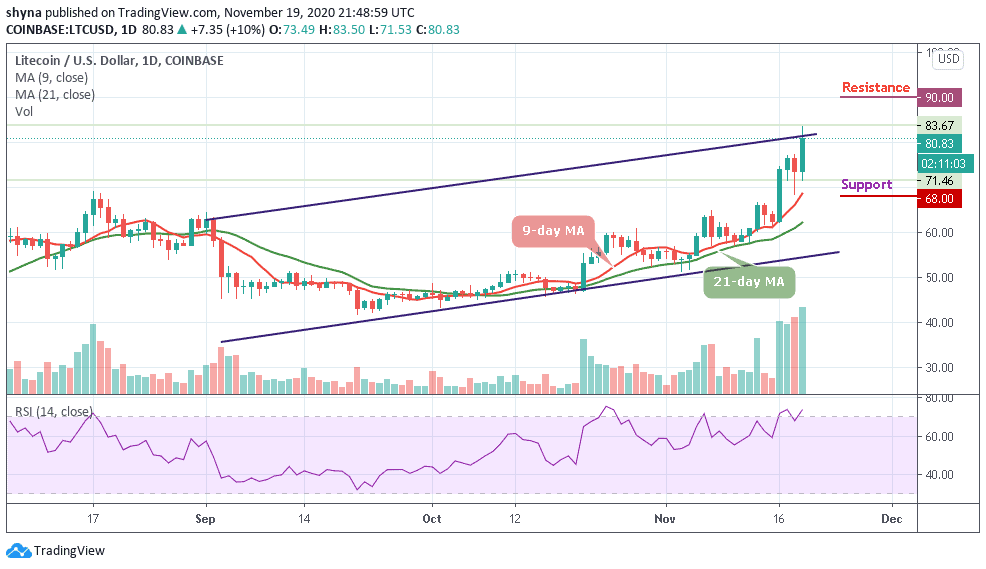
LTC/USD bulls have overcome the bears above the $70 support as the Litecoin bulls have survived the downward threat after breaking above the $80 resistance level. But if the price can cross above the channel, the upward movement will be confirmed by the bulls.
What is the Next Direction for Litecoin?
As the market continues its upward move, the bulls need to break above the channel to confirm the upside range trading. However, a break above this barrier may accelerate the price to retest the $83 resistance level. A possible rally to $85 is likely if the bulls overcome the $83 overhead resistance. More so, the resistance levels to watch are located at $90, $88, and $86 respectively.
In other words, if the bulls face rejection at the $81 resistance, there could be a bearish reaction. A downward movement of the coin is possible if the $75 and $70 support fails to hold. The bearish momentum may continue to drop to $68 after which the coin may reach a low of $66 and $64 if the previous support is broken.
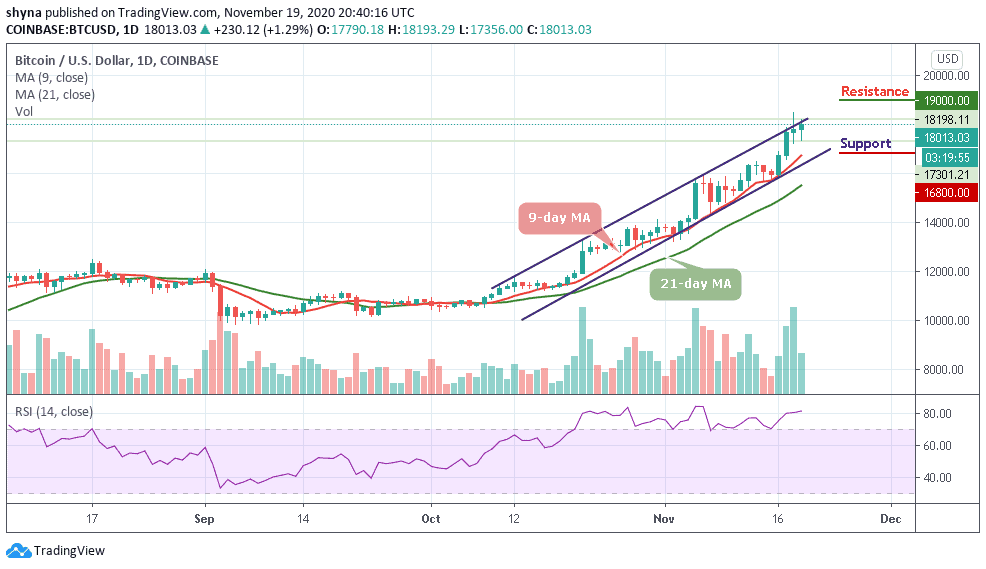
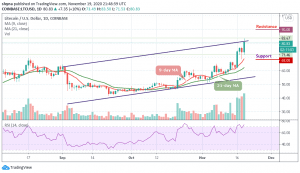
When compares with Bitcoin, LTC/BTC is still in a range and in a downward move. Meanwhile, the current movement describes that the buyers and sellers are undecided about the direction of the market. Any bullish movement above the upper boundary of the channel may push the coin to the resistance levels of 4900 SAT and above.

However, the RSI (14) indicates that LTC/BTC may continue to follow the upward movement within the channel. Breaking below the 9-day and 21-day moving averages may cause the coin to reach the low of 3800 SAT and below. Meanwhile, the technical indicator is crossing above the 60-level which confirms the bullish movement.
Join Our Telegram channel to stay up to date on breaking news coverage