Join Our Telegram channel to stay up to date on breaking news coverage
Bitcoin (BTC) Price Prediction – November 19
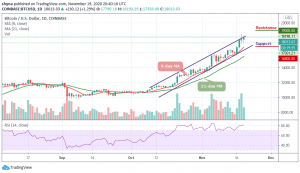
For a few days, the Bitcoin price has been trying to break above the $18,500 mark but with no success.
BTC/USD Long-term Trend: Bullish (Daily Chart)
Key levels:
Resistance Levels: $19,000, $18,800, $18,600
Support Levels: $16,800, $16,600, $16,400
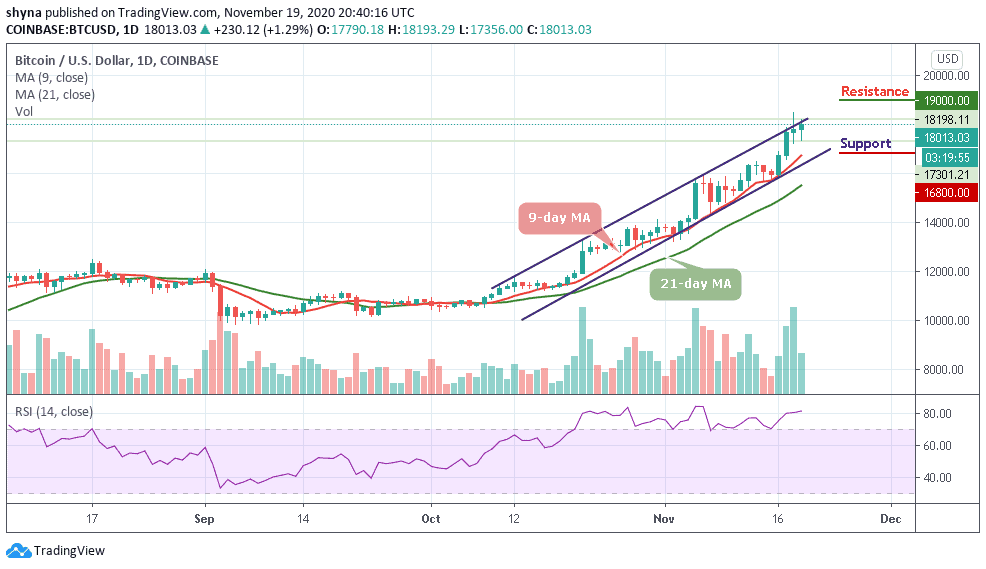
BTC/USD is currently trading at 1.29% higher on the day as the coin opens the session at $17,790 and now adjusting upwards to the prevailing market value of $18,200. However, the king coin is moving within the short-term bullish trend amid low volatility. The current conditions imply that the price may stay range-bound during the next trading hours as the coin moves above the 9-day and 21-day moving averages.
Where is BTC Price Going Next?
At the opening of the market today, after testing the low of $17,356, BTC/USD is currently trading at $18,013. Meanwhile, looking at the market movement, there is likely that the coin may experience a quick retracement if it moves above the upper boundary of the channel to touch the crucial $18,500 resistance.
On the downside, if the market decides to fall, the price of Bitcoin could fall below the 9-day moving average, and if that support fails to hold the sell-off, traders could see a further decline below the lower boundary of the channel and towards the support levels of $16,800, $16,600 and critically $16,400. All the same, any further bullish movement above the channel may hit the resistance levels of $19,000, $19,200, and $19,400 as the technical indicator RSI (14) remains within the overbought zone.
BTC/USD Medium – Term Trend: Bullish (4H Chart)
On the 4 hour chart, BTC/USD is trading at $17,999 as all eyes are glued on the $18,500 resistance level. Looking at the chart currently, the coin is seen moving above the 9-day and 21-day moving averages while the existing trend is ranging.
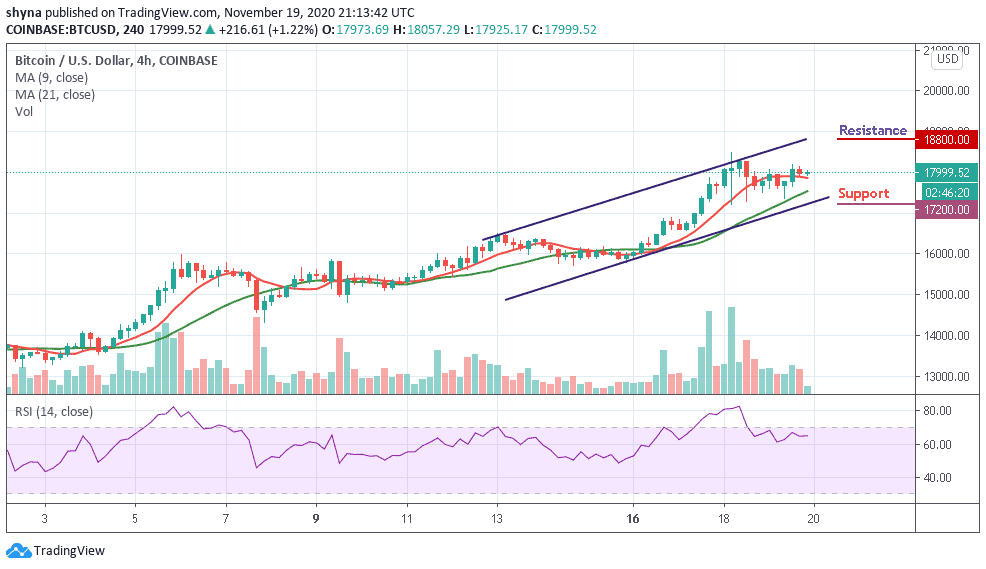
However, the Bitcoin price is recovering above the $17,900 level amidst fresh buying impetus. More so, the bullish trend line remained unbroken, which is why Bitcoin’s priority still remains the same and the coin may likely retest the $17,500 mark next. Therefore, if the technical indicator RSI (14) continues to follow the upward movement, the coin may likely reach the resistance level of $18,800 and above while the support level to watch lies at $17,200 and below.
Join Our Telegram channel to stay up to date on breaking news coverage