Join Our Telegram channel to stay up to date on breaking news coverage
LTC Price Prediction – November 3
Looking at the chart below, we can see that the Litecoin price is ready for a short-entry level near the $50 mark.
LTC/USD Market
Key Levels:
Resistance levels: $58, $60, $62
Support levels: $48, $46, $44
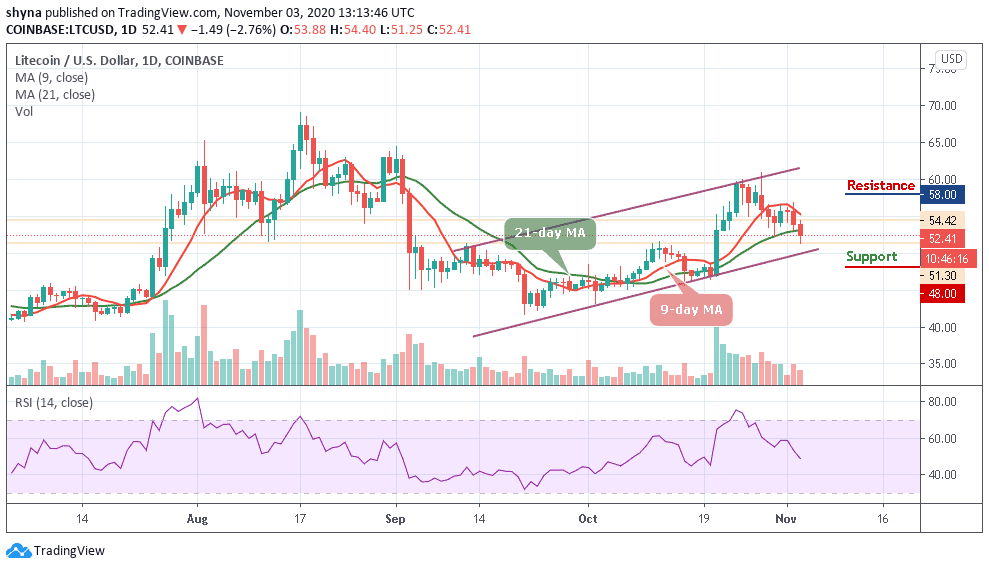
At the time of writing, LTC/USD is seen hovering below the 9-day and 21-day moving averages as the technical indicator RSI (14) slides below the 55-level. Meanwhile, a decreasing volume index also suggests a breakdown but a death cross is likely to come into the picture if the red-line of the 9-day moving average crosses beneath the green-line of the 21-day moving average in the daily chart.
What is the Next Direction for Litecoin?
With the look of things, if the coin moves toward the lower boundary of the channel, support is expected at $52, but LTC/USD might revisit the $50 level if the declines persist. The RSI (14) is currently flashing a sell signal aiming to cross below the 50-level which may be adding weight to the bearish outlook. Furthermore, if the 21-day moving average applied to this chart, turned into the support area for this coin, then, the declines are unlikely to extend below $50.
More so, should in case the daily bearish candle closes below $50, there is a high probability that the price may reach the support levels of $48, $46, and $44. Moreover, if the market price closes the day above the moving averages, the bearish outlook may be invalidated. Such a price action will encourage investors to hold still and stop panic selling. An increase in buy orders might create enough volume to support gains beyond $55. Any further bullish movement may reach the resistance levels of $58, $60, and $62 respectively.
Against Bitcoin, the Litecoin price keeps moving sideways, trading below the 9-day and 21-day moving averages. Should in case a trend reversed, there could be an upsurge in the market. Now, the coin is trading around the 3883 SAT, moving below the channel may cause it to hit the support at 3600 SAT and below.
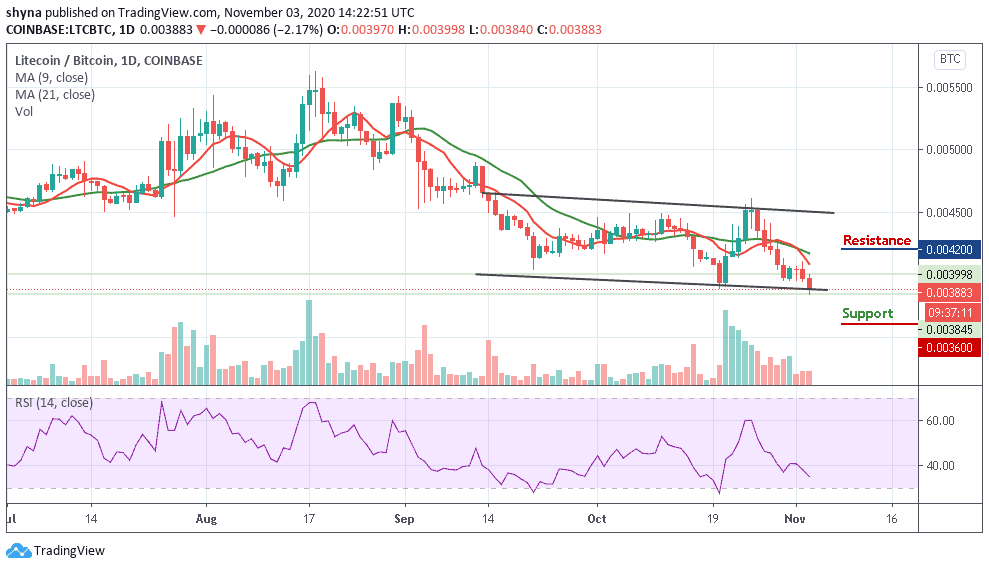
However, if a bullish move occurs and validates a break above the moving averages, the price may likely hit the potential resistance at 4200 SAT and above. Meanwhile, the RSI (14) is seen moving below the 35-level to increase the bearish momentum.
Join Our Telegram channel to stay up to date on breaking news coverage