Join Our Telegram channel to stay up to date on breaking news coverage
Bitcoin (BTC) Price Prediction – November 3
BTC/USD remains at the upside as the bulls are holding tight to the BTC market ever since the price action tested the $13,215 support yesterday.
BTC/USD Long-term Trend: Bullish (Daily Chart)
Key levels:
Resistance Levels: $14,400, $14,600, $14,800
Support Levels: $12,800, $12,600, $12,400
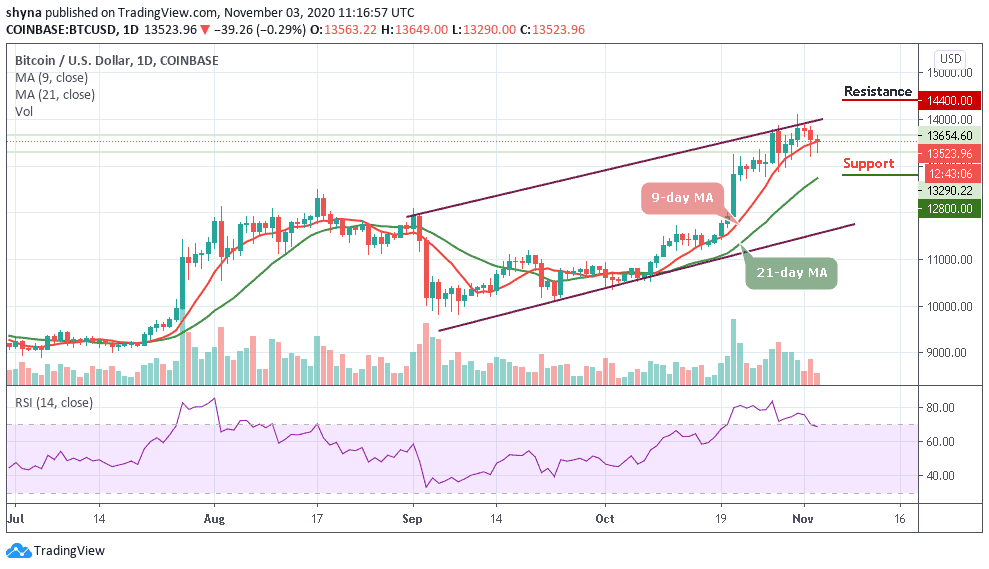
According to the daily chart, BTC/USD experiences another unexpected selloff as the market opens in the early trading session of today. The first digital asset drop sharply to touch the support of $13,290. However, a reversal quickly occurred, which sent the king of crypto assets under the same $14,000 level. More so, BTC/USD also crossed beneath the 9-day moving average, opening the road to losses eyeing $13,000.
Where is BTC Price Going Next?
Presently, BTC/USD is seen retracing and trading around the fast-moving 9-day moving average and the market price stays under the daily high of $13,649 resistance as a sign of bullish momentum. Further increase in the bullish momentum may increase the price above the resistance level of $13,700; above it is another resistance at $14,000 before reaching the potential resistance of $14,400, $14,600, and $14,800 levels.
However, should the $13,500 resistance level holds, the price may reverse and face the support level at $13,200, further increase in the bears’ pressure may push down the price towards the 21-day moving average and possibly hit the critical supports at $12,800, $12,600, and $12,400. Meanwhile, the technical indicator RSI (14) signal line is pointing at the 70-level, crossing below it may ignite more sell signals into the market.
BTC/USD Medium – Term Trend: Ranging (4H Chart)
According to the 4-hour chart, the fast-moving 9-day MA remains below the slow-moving 21-day MA; the market price is trading below the two moving averages as a sign of bearish momentum. However, in case the current market value of $13,500 level still holds, the bears may exert pressure to break down the important support level and the price may decline to $13,250 and below.
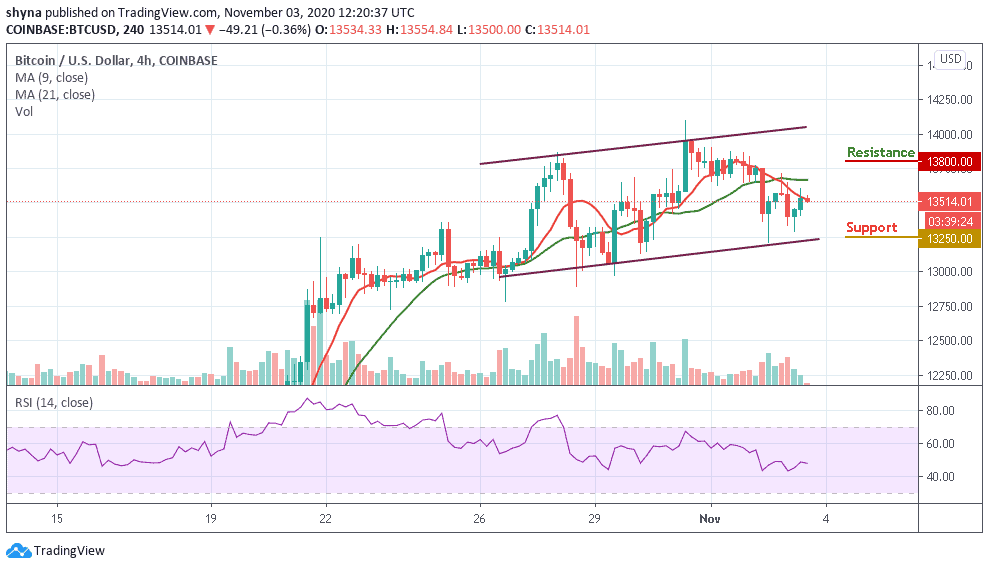
Moreover, should the bulls increase their pressure and push the market price above the 9-day moving average, the resistance level of $13,600 may be penetrated and the price may increase to $13,800 and above. Meanwhile, the technical indicator RSI (14) is moving around 49-level to indicate a sideways movement while crossing below this level may suggest a bearish signal.
Join Our Telegram channel to stay up to date on breaking news coverage