Join Our Telegram channel to stay up to date on breaking news coverage
LTC Price Prediction – January 3
LTC/USD manages to maintain its position, while the bulls maintain the desire to defend the support at $40.
LTC/USD Market
Key Levels:
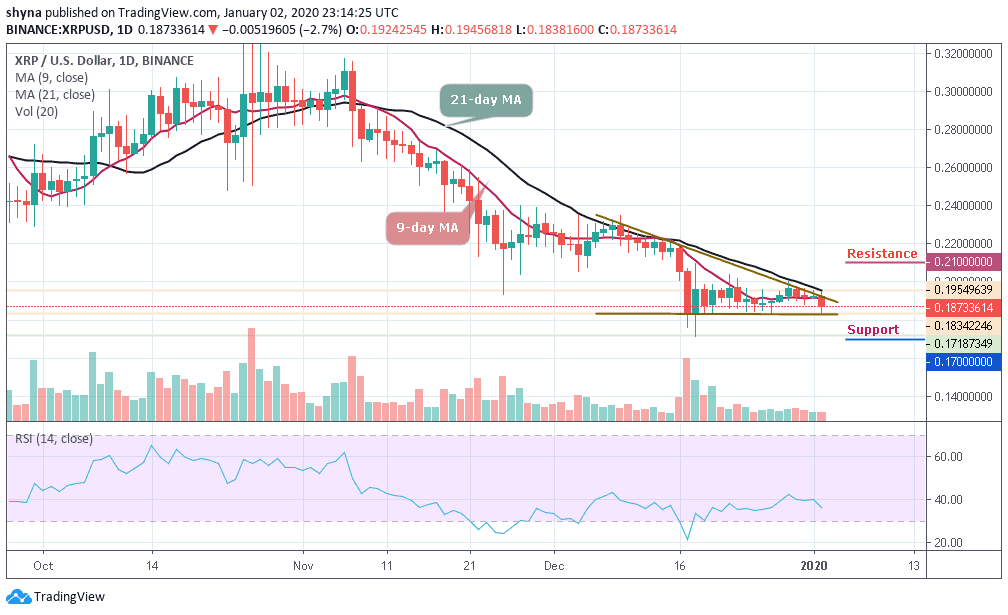
Resistance levels: $44, $46, $48
Support levels: $36, $34, $32

After being locked below the moving averages on the price charts, LTC/USD underwent a much-needed break to the positive side. The coin posted gains of over 5.62% in the last 24 hours, with the coin trading above the 9-day and 21-day moving averages and at a price of $41.53 as at the time of writing.
Today, LTC/USD has resumed back in the middle of consolidation after a slight drop from near the $41 yesterday. The price is now roaming around the $41.53 level. If the market continues the surge and squeeze, the $42 resistance level is likely to surface in the next few positive moves. More so, the LTC/USD pair might further look for higher price levels if the bulls continue to show commitment.
However, the market is currently displaying a sign of subduing volatility with choppy price action. Meanwhile, taking a look at the top level forex brokers prediction charts, we can see the trading volume is rising slowly. If the LTC/USD pair decides to stay under the control of bears, the price may roll back to the previous supports at $36, $34 and $32. But on the upside, we can expect the next level of resistance at $44, $46 and $48.
Moreover, the RSI (14) is hovering around the $45-level, which indicates that bullish movement may continue to come into play.
Comparing LTC with BTC, the support level of this range is built around 5500 SAT, while the resistance level is set at 5800 SAT because the market price is still moving towards the moving averages of 9 and 21 days. Technically, the price might continue a sideways movement within the ascending wedge until the stochastic RSI indicator is ready to start moving down.
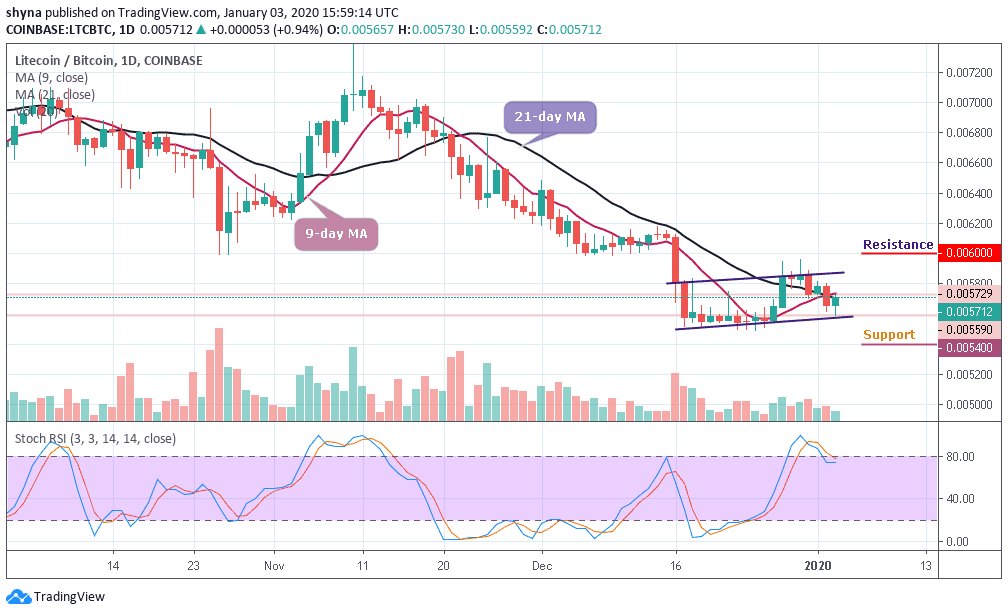
However, should in case the litecoin market price continues to move in an uptrend after the decision of the technical indicator, it may likely break above the channel to reach the resistance levels at 6000 SAT, 6200 SAT and 6400 SAT respectively. Conversely, the market may find support at 5400 SAT, 5200 SAT and 5000 SAT if the bears take control.
Please note: Insidebitcoins.com is not a financial advisor. Do your research before investing your funds in any financial asset or presented product or event. We are not responsible for your investing results.
Join Our Telegram channel to stay up to date on breaking news coverage