Join Our Telegram channel to stay up to date on breaking news coverage
LTC Price Prediction – July 2
The Litecoin price moves closer to the support of $40 as the bearish signals are still very much around.
LTC/USD Market
Key Levels:
Resistance levels: $45, $47, $49
Support levels: $37, $35, $33

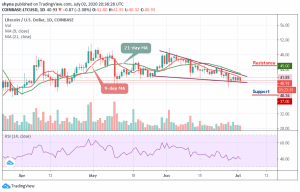
Today, LTC/USD is seen looking bearish as the price tested and printed below $42 to touch the low of $40.34 support level. The price is also trading under both 9-day and 21-day moving averages within the symmetric triangle. Looking at the daily indicator, the RSI (14) is seen trading above 40-level. The volume has also picked up as the selling kicked in. Therefore, $38 will now be the main level of support that needs to be watched.
Today, the market opens without any rise after which the bears grabbed the price and dragging it below the point where it touches the daily low of $40.34 support level. With this fall, the coin might not be able to maintain its effectiveness before showing some signs of downward trends.
However, the intraday movement of the coin is quite unstable, but starting at $41, a rebound may likely occur, and if the bulls can put more effort to push the Litecoin price to cross above the moving averages and the upper boundary of the channel. The potential resistances to watch are $45, $47, and $49 while the supports are $37, $35, and $33 levels.
When compares with Bitcoin, the LTC price is experiencing some difficulties since last month. Recently, the coin exploded under the solid support of 4422 SAT and continued to fall towards 4400 SAT. The critical support level is located below the 9-day and 21-day moving averages at level 4300 SAT and below.
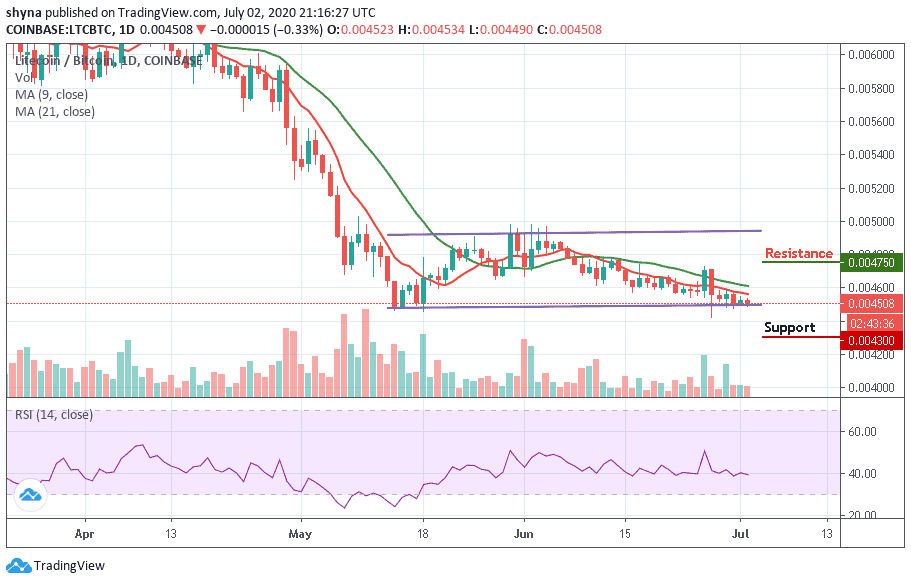
However, any attempt by the bulls to move the market higher, it may likely cross the moving averages to find the potential resistance level of 4750 SAT and above. Meanwhile, looking at the daily chart, the price of Litecoin is currently changing hands at 4508 SAT and the coin may begin to consolidate as the technical indicator RSI (14) moves in the same direction, suggesting a sideways movement.
Join Our Telegram channel to stay up to date on breaking news coverage