Join Our Telegram channel to stay up to date on breaking news coverage
Bitcoin (BTC) Price Prediction – July 2
At the moment, BTC/USD is seen dropping over 0.52% within 24 hours as it trades at the $9,192 level.
BTC/USD Long-term Trend: Bearish (Daily Chart)
Key levels:
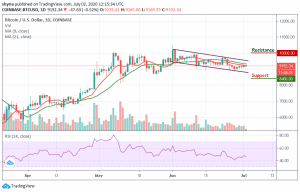
Resistance Levels: $10,000, $10,200, $10,400
Support Levels: $8,400, $8,200, $8,000

The daily chart reveals that BTC/USD failed to break the 9-day and 21-day moving averages with the current consolidation pattern as it fails to close above the $9,200 level. The Bitcoin (BTC) started the day off by trending lower toward the $9,000 level inside the descending channel. Similarly, the first level of support is located at $8,800. Beneath this, support lies at $8,400, $8,200, and $8,000 levels.
However, this marks another day that Bitcoin has failed to break above this channel as it looks to set up another few days of negative price declines beneath $9,000. A break above this channel would have set Bitcoin up to reach the $9,500 level; however, this is looking less and less likely with each failed breakout attempt as the RSI (14) moves around 45-level.
Furthermore, we can clearly see Bitcoin fails to break up above the upper boundary of the channel. Today, it couldn’t go higher but seen dropping beneath the $9,200 level. Although the candle is still yet to close, however, it does look unlikely that the bulls may end up closing above this resistance should in case the technical indicator moves above 50-level. More so, toward the upside, resistance lies at $10,000, $10,200, and $10,400.
BTC/USD Medium-Term Trend: Bearish (4H Chart)
Looking at the 4-hour chart, the bears are now coming back into the market tremendously while the bulls failed to defend the $9,000. Nevertheless, the $8,800 and below may come into play if the bearish momentum increases in the markets.
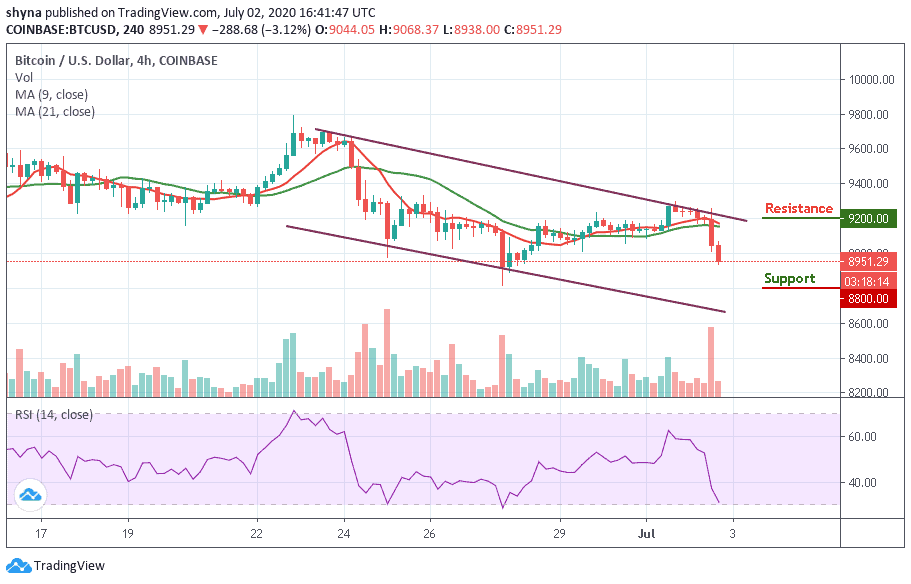
However, if the buyers hijack the current movement and power the market, traders may expect a retest at $9,000 resistance level; breaking this level may further allow the bulls to hit $9,200 and above. At the moment, the RSI (14) signal line is seen moving into the negative side which may give more bearish signals in the near future.
Join Our Telegram channel to stay up to date on breaking news coverage