Join Our Telegram channel to stay up to date on breaking news coverage
LTC Price Prediction – July 20
The Litecoin is declining by more than 1.57% over a day; full price recovery might take quite a while.
LTC/USD Market
Key Levels:
Resistance levels: $44, $46, $48
Support levels: $40, $38, $36

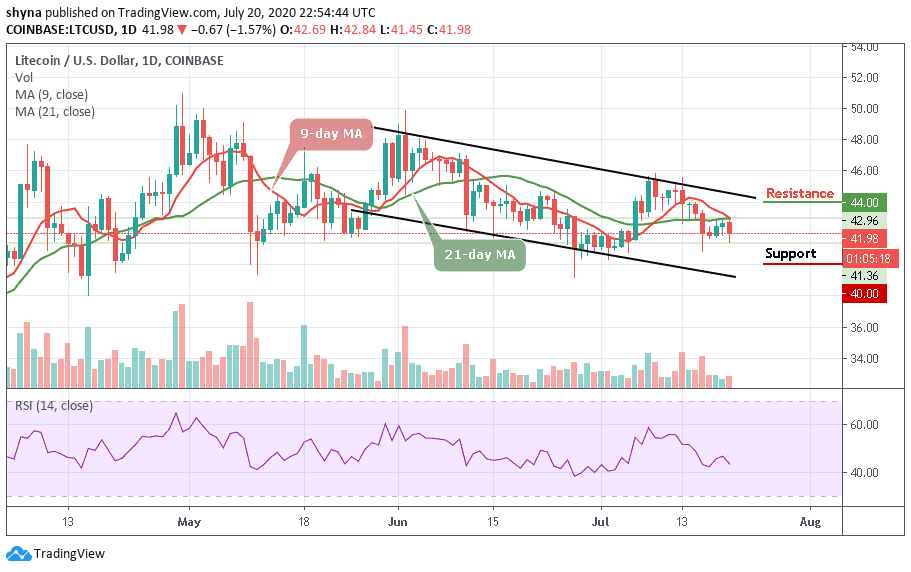
LTC/USD is seen trading below the 9-day and 21-day moving averages after a bullish rally failed to materialize. In fact, the crypto is trading in a downtrend after the bulls took over from the bears. Today, an early trading session towards the $42 level failed to generate sustainable gains, with LTC/USD pair slipping towards the support of $41.
However, the longer the pair fails to rally from current trading levels, the greater the chance that we may see the cryptocurrency falling below the moving averages. A break below the $41 support level may provoke an even deeper decline towards the $40, $38, and $36 support levels.
Moreover, the daily chart reveals that LTC/USD needs to break the technical region of the $43 level which is above the moving averages of the descending channel. In as much as the 9-day MA is above the 21-day MA, the coin may likely push higher to reach the resistance levels of $44, $46, and $48. Meanwhile, the RSI (14) is facing the south, which indicates more bearish signals are in focus.
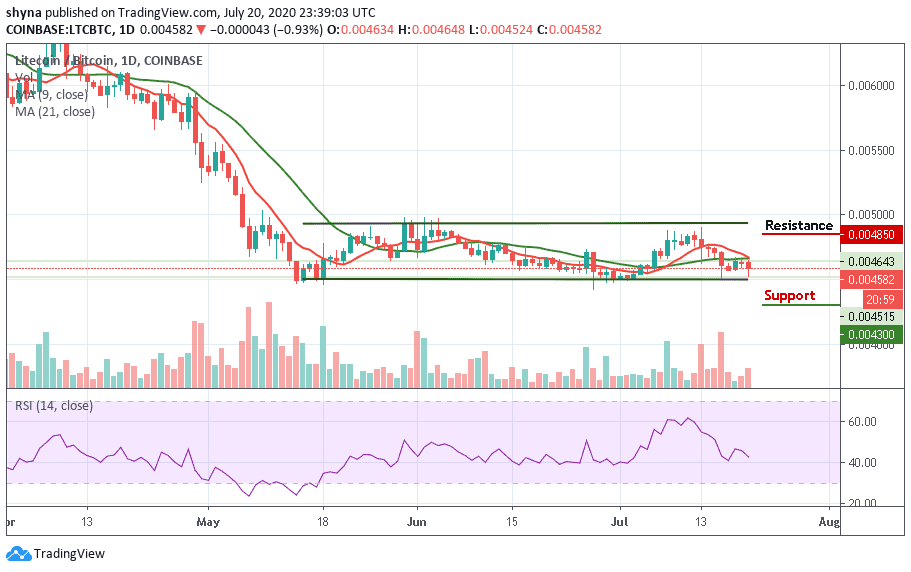
When compared with Bitcoin, the Litecoin price is experiencing some difficulties, as the coin recently exploded under the solid support of 4600 SAT and continued to fall towards the 4500 SAT. The critical support level is located below the 9-day moving average at level 4300 SAT and below.

However, any attempt by the bulls to re-power the market, the coin can likely cross the moving averages to find the potential resistance level at 4850 SAT and above. Meanwhile, the price of Litecoin is currently changing hands to 4582 SAT and a spike in volatility could occur as the technical indicator RSI (14) is still moving below 45-level.
Join Our Telegram channel to stay up to date on breaking news coverage

