


Join Our Telegram channel to stay up to date on breaking news coverage
Bitcoin (BTC) Price Prediction – July 20
The Bitcoin bulls are already losing control as the coin targets a $9,000 support level.
BTC/USD Long-term Trend: Ranging (Daily Chart)
Key levels:
Resistance Levels: $9,700, $9,900, $10,100
Support Levels: $8,700, $8,500, $8,300
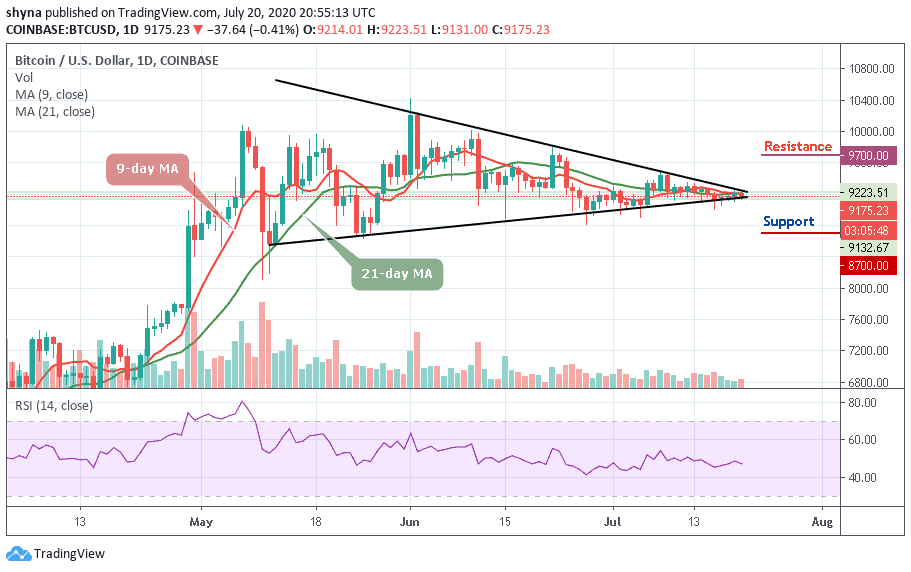
BTC/USD resumes the decline after touching the daily high of $9,223 in the early hours of the trading session today. At the time of writing, BTC/USD is changing hands at $9,175, down nearly 0.41% since the beginning of the day. The first digital coin has been drifting lower since the start of the day as the upside momentum has faded away on approach to $9,200. Currently, BTC/USD is moving within a short-term bearish trend as the volatility is low.
However, on the intraday charts, the Bitcoin (BTC) may be vulnerable to further losses if the price settles below the lower boundary of the channel at $9,100. More so, BTC/USD still remains in the range as long as the lower boundary of the recent consolidation channel which is $9,000 remains unbroken.
According to the technical indicator RSI (14), as the market follows the sideways movement, the price may trigger either way for Bitcoin to rise or fall and any upward breakout may push the coin to retest the $9,500 resistance. Higher resistance level could be found at $9,700, $9,900, and $10,100 while the critical supports lie at $8,700, $8,500, and $8,300 respectively.
BTC/USD Medium-Term Trend: Bullish (4H Chart)
Comparing with the 4-hour chart, the bears have been in the control of the market for the past few hours, but the bulls are now stepping back into the market, trying to defend the $9,100 support. If not, the $9,080 and below may come into play if BTC breaks below the mentioned supports.
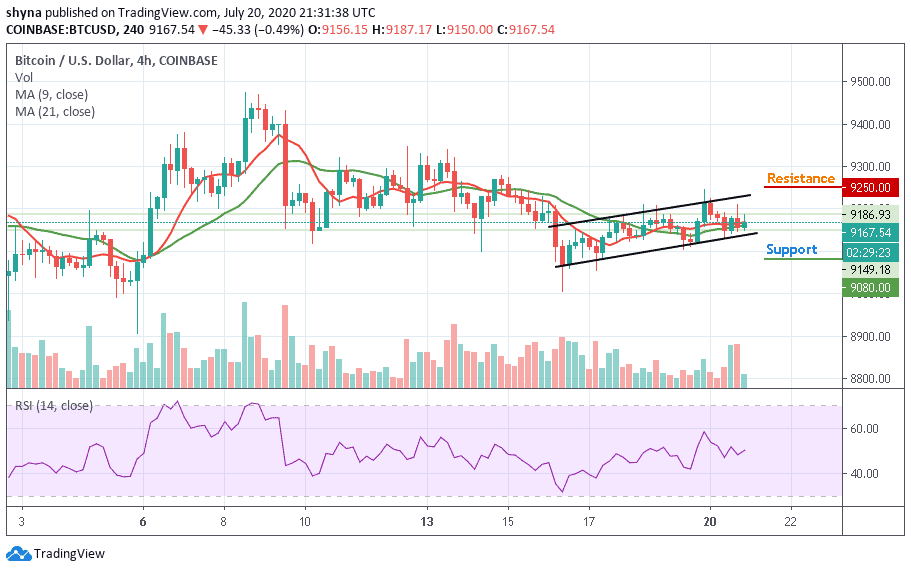
However, in as much as the buyers can reinforce and power the market, traders can expect a retest at $9,200 resistance level, and breaking this level may likely push the coin to the resistance level of $9,250 and above. The RSI (14) is moving in an uptrend, suggesting bullish signals.
Join Our Telegram channel to stay up to date on breaking news coverage
