Join Our Telegram channel to stay up to date on breaking news coverage
XRP Price Prediction – July 19
The Ripple’s $0.202 aligns as a critical resistance that keeps bulls in check.
XRP/USD Market
Key Levels:
Resistance levels: $0.215, $0.220, $0.225
Support levels: $0.185, $0.180, $0.175

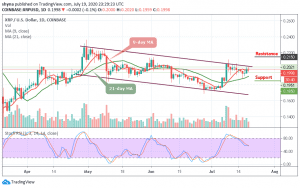
After dropping for three straight days consecutively and losing nearly 3% during that period, XRP/USD rose sharply on yesterday and gained 2.85% to close near $0.202. However, the pair seems to be having a tough time building on its recent gains and was last seen losing 0.1% on the day at $0.199.
Although Ripple (XRP) is edging lower on today, the coin continues to trade above the 9-day and 21-day moving averages that it broke yesterday. Meanwhile, the RSI indicator on the daily chart is pulling away from yesterday’s high of 60-level but stays above 50, suggesting that the fall is a technical correction.
Moreover, the pair is currently changing hands at $0.199, any attempt to make it close below the 9-day and 21-day moving averages, this may open the doors for more downsides and the price could spike below the $0.185 support level. However, we should keep an eye on the $0.180, and $0.1755 before creating a new bullish trend at the resistance levels of $0.215, $0.220, and $0.225.
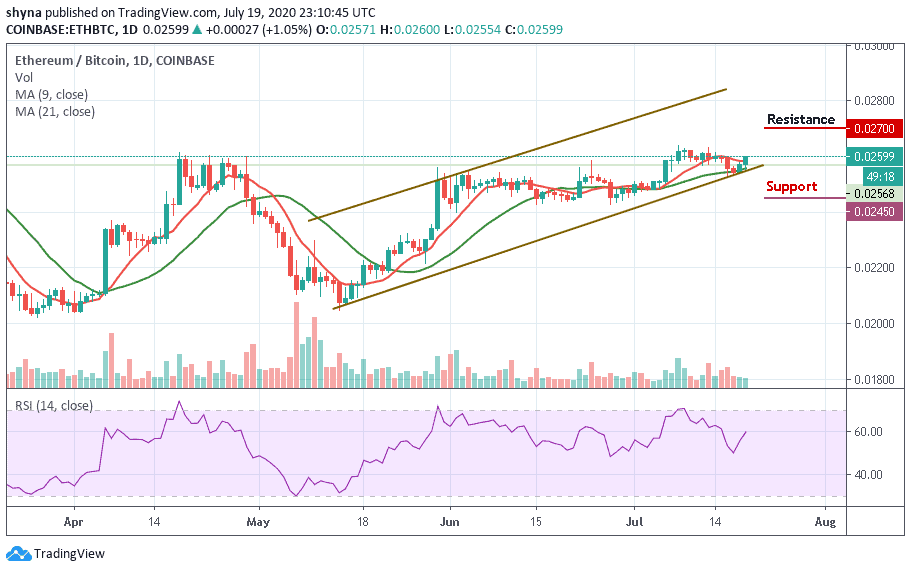
Against Bitcoin, the situation is becoming bleak as the market trades above the 9-day moving average at 2167 SAT. The XRP/BTC has not been able to break above this resistance level, causing a drop down to 2148 SAT. The market opens today with an upward trend where it touches the daily high of 2202 SAT at the time of writing.
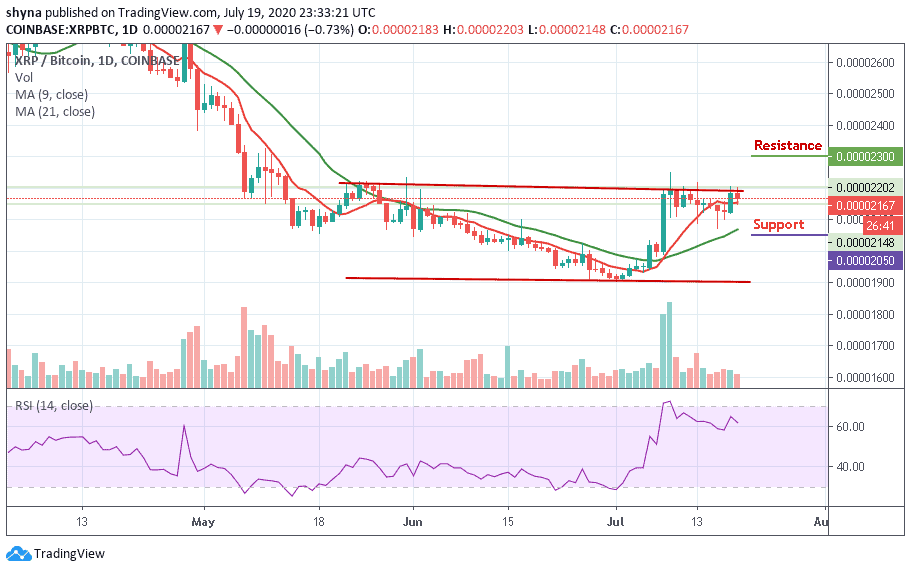
However, looking at the daily chart, should in case the bulls failed to push the price to the north, then the bears may likely step back into the market and bring the price back below the 9-day moving average at the nearest support levels at 2050 SAT and 2000 SAT. Meanwhile, the RSI (14) moves above 60-level, which indicates that the bullish movement may continue.
Join Our Telegram channel to stay up to date on breaking news coverage