Join Our Telegram channel to stay up to date on breaking news coverage
LTC Price Prediction – November 16
Litecoin (LTC) price moves towards the immediate support level as the recovery indicates stalling signs.
LTC/USD Market
Key Levels:
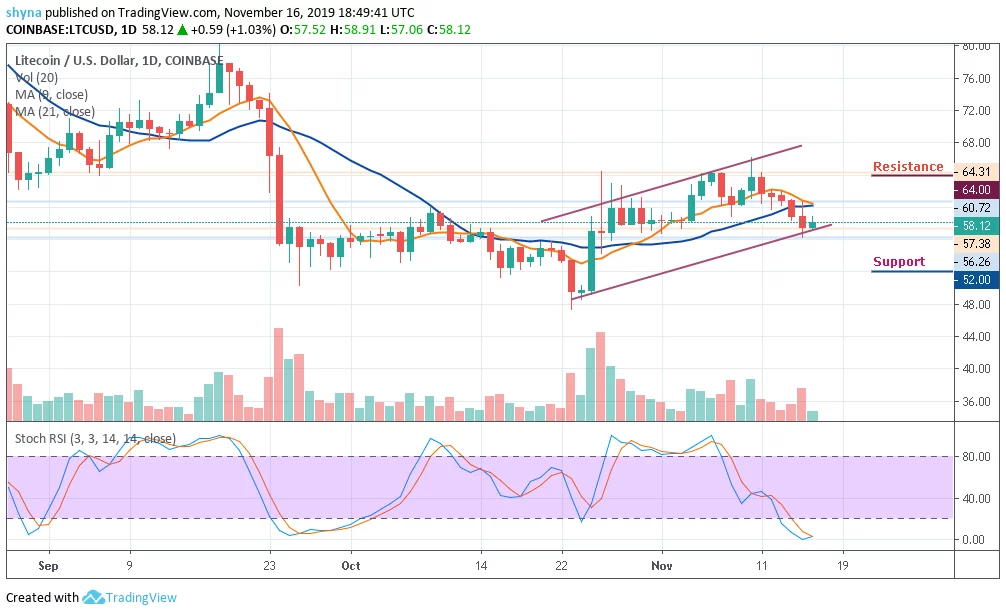
Resistance levels: $64, $66, $68
Support levels: $52, $50, $48
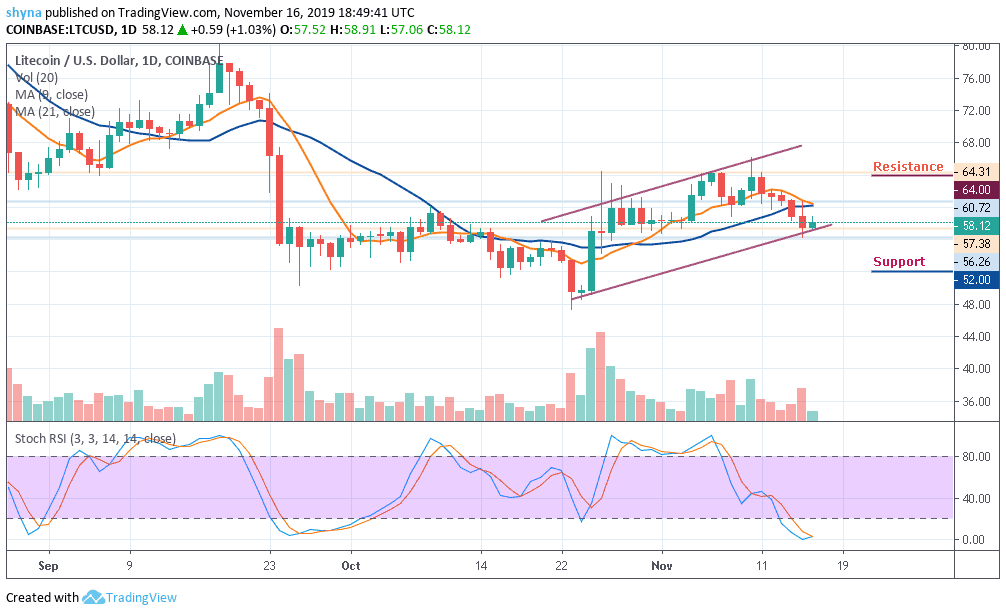
LTC/USD registers recovery with its intraday movement. The improvement in the trading price of the coin is anticipated to have a short span. The intraday traders might experience a loss by the end of the day. The entire market is suffering currently. The volatility has created chaos in the market. The traders are eagerly waiting for recovery.
On the daily chart, after crossing below the lower boundary of the ascending channel, LTC/USD is supported by psychological $56 level below the 9-day and 21-day moving averages. Once it is out of the way, the sell-off is likely to gain traction with the next focus on $54. The next bearish target awaits us on approach to $52, $50 and $48 support levels.
On the upside, the initial recovery is limited by $60 around the moving averages located on approach. We will need to see a sustainable move above this handle for the upside to gain traction towards $64, $66 and $68 resistance levels. The stochastic RSI is within the oversold territory showing a decreasing bullish momentum.
Comparing with Bitcoin, the Litecoin price continues to trend bearishly as the support further outweighs the resistance. For a trend reversal, there’s a need for an increasing volume and resistance to cause an upsurge in the market. Now, the token is trading around the 6863 SAT within the moving averages. We can expect close support at the 6620 SAT before breaking to 6400 SAT and potentially 6200 SAT support.
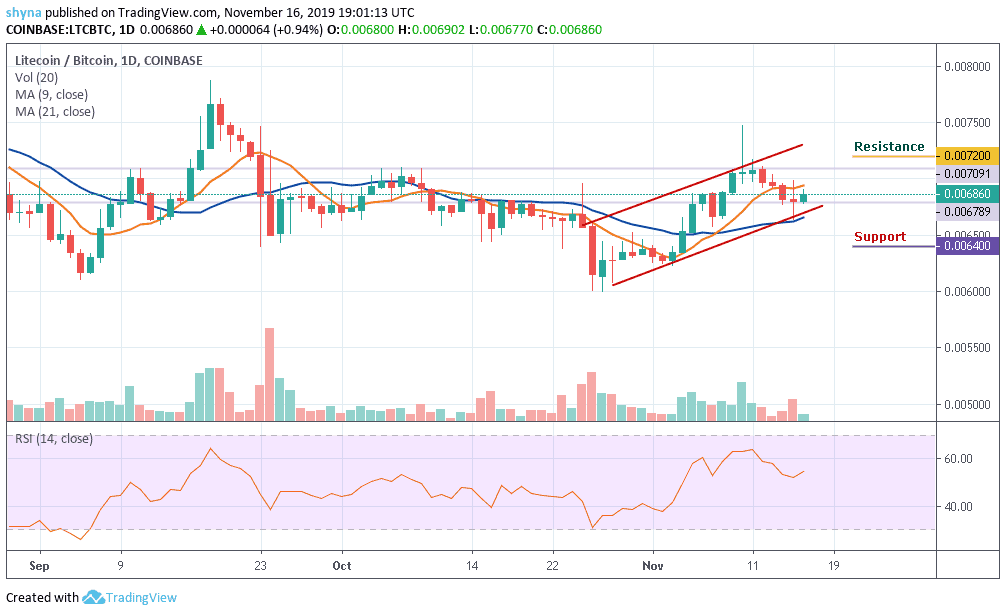
Currently, there’s a sign of a bullish move in the LTC market. However, if a bullish move occurs and validates a break significantly above the 9-day and 21-day MA to hit the nearest resistance at 7000 SAT; we can then confirm a bull-run for the LTC/BTC pair. For now, the closest resistance lies at 7200 SAT and 7400 SAT as the RSI (14) moves around level 53.
Please note: Insidebitcoins.com is not a financial advisor. Do your research before investing your funds in any financial asset or presented product or event. We are not responsible for your investing results.
Join Our Telegram channel to stay up to date on breaking news coverage